Lights, Camera, Action: PVR Inox set to star in a profitable sequel

Lights, Camera, Action: PVR Inox set to star in a profitable sequel


Since hitting lows in the first week of August, the stock of India’s largest multiplex operator, PVR Inox (PVR), has risen roughly 20 per cent, outperforming the benchmark S&P BSE Sensex, which gained 9 per cent during the same period. Following a muted April-June quarter (Q1) for 2024-25 (FY25), the improving sentiment for the stock can be attributed to a robust movie pipeline, which is expected to enhance collections in the July-September (Q2) and October-December (Q3) quarters, alongside expectations for deleveraging.


Q2 featured several blockbusters, including Kalki 2898 AD, Stree 2, Deadpool & Wolverine, and Raayan, among others. While PVR holds market shares of 40 per cent in Bollywood, 20 per cent in regional films, and 60 per cent in Hollywood, Anand Rathi Research anticipates a sequential improvement in occupancy and average ticket prices beginning in Q2. The company reported Q1 occupancy at 20.3 per cent, with average ticket prices at Rs 235. Revenue growth for the quarter is projected to increase by 20 per cent on a sequential basis, with operating profit margins between 10 per cent and 12 per cent.

Click here to connect with us on WhatsApp


Most brokerages believe the content pipeline in Q3 will enable the company to surpass its Q2 performance for 2023-24 (FY24), which was its best quarter to date. Analysts Abhishek Banerjee and Jayram Shetty of ICICI Securities expect PVR to benefit from a strong content lineup in Q3FY25, with highly anticipated movie releases such as Pushpa 2: The Rule, Bhool Bhulaiyaa 3, and Singham Again, among others.


This quarter features five mega-budget movies, including regional films, set to release during the festival season. The company may also see increased advertising spending as advertisers seek to capitalise on higher footfall.


The exhibitor is implementing strict cost control measures, which, combined with synergy gains, are expected to enhance its margins. Pre-pandemic, PVR achieved 20 per cent margins with occupancy levels of 33-34 per cent. Currently, the occupancy rate required to reach similar margins has decreased by 350-450 basis points. In August 2024, the company recorded an occupancy of 28.5 per cent and ended the month with 20 per cent margins, which is encouraging, according to B&K Securities.


PVR is aiming to reduce its debt by adopting an asset-light approach and lowering capital expenditure (capex) intensity in its business. The company is entering joint ventures with developers to invest in new screen capex and plans to reduce overall capex in FY25 by 25 per cent compared to FY24.


It is being selective about screen additions, targeting 120 new screens in FY25 and prioritising expansion efforts in the underpenetrated South Indian market. About 10 per cent and 20-25 per cent of gross screen additions for FY25 and 2025-26, respectively, will follow the management fee or revenue-sharing model. The management fee is set at 9 per cent of net collections, while the revenue-sharing model will require the developer to cover 70-80 per cent of the capex.


In addition to the content pipeline, efforts to reduce debt (through monetising three properties in Mumbai, Pune, and Vadodara) and improve operational efficiencies by adopting an asset-light model bode well for earnings growth and stock rerating, say analysts Shobit Singhal and Pranay Shah of Anand Rathi Research.


While the brokerage has maintained its ‘buy’ rating with a target price of Rs 2,065 per share, ICICI Securities has reiterated a ‘buy’ call on the stock with a target price of Rs 2,250. At the current market price, these target prices suggest returns in excess of 21 per cent. While B&K Securities has raised its medium- to long-term estimates for PVR, given cost rationalisation and lower capex intensity moving forward, it maintains a cautious stance on the sector with a ‘hold’ rating and a target price of Rs 1,624.

First Published: Sep 29 2024 | 10:47 PM IST


Source link

IPO rush: Hyundai, Swiggy among cos looking to raise Rs 60K cr in Oct-Nov

IPO rush: Hyundai, Swiggy among cos looking to raise Rs 60K cr in Oct-Nov


Swiggy’s IPO consists of a fresh issue of shares worth Rs 3,750 crore.


The primary market will remain abuzz with more than half a dozen companies, including Hyundai Motor India, Swiggy, and NTPC Green Energy, lined up initial public offerings over the next two months to raise around Rs 60,000 crore, merchant bankers said.


Apart from these three firms, Afcons Infrastructure, Waaree Energies, Niva Bupa Health Insurance, One Mobikwik Systems, and Garuda Construction are among the companies planning to launch initial public offerings (IPOs) during October-November, they added.

Click here to connect with us on WhatsApp


Together, these firms are looking to raise Rs 60,000 crore through their IPOs.


Munish Aggarwal, Managing Director and Head – Equity Capital Markets at Equirus, expects over 30 IPOs to be launched between September-end and December. This will be across sectors, deal sizes and a combination of fresh issues and offers for sale.


The strong momentum in IPO markets is driven by several key macroeconomic, sector-specific factors and the willingness of funds to look at new ideas, which is partially led by strong inflows into domestic mutual funds and the robust capital formation happening across corporate India, he added.


The companies are tapping the primary market to raise funds for expansion plans, retire debt, support working capital requirements and provide exit routes to the existing shareholders.


Hyundai Motor India Ltd, the Indian subsidiary of South Korea’s Hyundai Motor Company, is expected to raise Rs 25,000 crore, making it the largest-ever IPO in India.


This could surpass LIC’s Rs 21,000-crore initial share sale.


The automaker’s entire issue will be an offer-for-sale (OFS) of 14,21,94,700 shares by Hyundai Motor Company, with no fresh issue component, according to its draft red herring prospectus (DRHP).


Other major IPOs lined up include food and grocery delivery giant Swiggy, which according to sources, is targeting to raise Rs 10,414 crore via fresh issue and OFS.


Swiggy’s IPO consists of a fresh issue of shares worth Rs 3,750 crore and an OFS component of 18.52 crore worth Rs 6,664 crore.


Further, NTPC Green Energy, the renewable energy arm of state-owned NTPC, is looking to launch its Rs 10,000 crore IPO in the first week of November, sources told PTI earlier.


Shapoorji Pallonji Group’s construction firm Afcons Infrastructure will also join the IPO rush with a Rs 7,000 crore offer while Waaree Energies is expected to raise Rs 3,000 crore through a fresh issue of shares, in addition to an OFS component.


Niva Bupa Health Insurance and One Mobikwik Systems are planning to raise Rs 3,000 crore and Rs 700 crore, respectively.


Moreover, 62 companies, including Bajaj Housing Finance, Ola Electric Mobility, and FirstCry’s parent Brainbees Solutions have already mobilised around Rs 64,000 crore collectively via mainboard, marking a 29 per cent increase from Rs 49,436 crore collected by 57 firms through the route in 2023.


The primary market is experiencing strong interest from issuers and investors across various sectors.


Going ahead, the outlook for the IPO market in 2025 remains broadly positive as Sebi approved 22 IPOs as of now with companies planning to raise around Rs 25,000 crore, V Prashant Rao Director & Head – ECM, Investment Banking at Anand Rathi Advisors, said.


Additionally, over 50 firms have filed draft papers and are awaiting approval.


Cumulatively, these companies aim to raise more than 1 lakh crore, reflecting the significant momentum in the IPO market, he added.


The positive sentiment is supported by strong macroeconomic fundamentals, favourable market conditions, and sectoral growth.


Further, there are no signs of the IPO frenzy fizzling out and this behaviour might persist in the short term. However, risks like market corrections and regulatory interventions could moderate the enthusiasm, Vaibhav Porwal, Co-founder, Dezrev, said.

(Only the headline and picture of this report may have been reworked by the Business Standard staff; the rest of the content is auto-generated from a syndicated feed.)

First Published: Sep 29 2024 | 11:07 AM IST


Source link

Mcap of 8 most valued firms surges Rs 1.21 trn; Reliance biggest winner

Mcap of 8 most valued firms surges Rs 1.21 trn; Reliance biggest winner


In the chart of the most valued firms, Reliance Industries retained the highest ranking. (Photo: Shutterstock)


The combined market valuation of eight of the top-10 most valued firms surged Rs 1,21,270.83 crore last week, with Reliance Industries becoming the biggest gainer, in line with an outstanding rally in benchmark equity indices.


Last week, the BSE benchmark jumped 1,027.54 points or 1.21 per cent. The BSE Sensex hit its record high of 85,978.25 on Friday.

Click here to connect with us on WhatsApp


The market valuation of Reliance Industries jumped Rs 53,652.92 crore to Rs 20,65,197.60 crore.


State Bank of India added Rs 18,518.57 crore taking its valuation to Rs 7,16,333.98 crore.


Bharti Airtel’s market valuation soared Rs 13,094.52 crore to Rs 9,87,904.63 crore and that of ITC grew by Rs 9,927.3 crore to Rs 6,53,834.72 crore.


The market capitalisation (mcap) of Tata Consultancy Services (TCS) surged Rs 8,592.96 crore to Rs 15,59,052 crore.


HDFC Bank’s valuation climbed Rs 8,581.64 crore to Rs 13,37,186.93 crore and that of Life Insurance Corporation of India (LIC) zoomed Rs 8,443.87 crore to Rs 6,47,616.51 crore.


The mcap of Infosys went up by Rs 459.05 crore to Rs 7,91,897.44 crore.


However, the market valuation of ICICI Bank tumbled Rs 23,706.16 crore to Rs 9,20,520.72 crore.


The mcap of Hindustan Unilever declined by Rs 3,195.44 crore to Rs 6,96,888.77 crore.


In the chart of the most valued firms, Reliance Industries retained the highest ranking, followed by TCS, HDFC Bank, Bharti Airtel, ICICI Bank, Infosys, State Bank of India, Hindustan Unilever, ITC and LIC.

(Only the headline and picture of this report may have been reworked by the Business Standard staff; the rest of the content is auto-generated from a syndicated feed.)

First Published: Sep 29 2024 | 10:36 AM IST


Source link

Markets to track global cues, trading activity in holiday-shortened week

Markets to track global cues, trading activity in holiday-shortened week


Equity markets would remain closed on Wednesday for Mahatma Gandhi Jayanti. (Photo: Shutterstock)


Global trends, trading activity of foreign investors and domestic macroeconomic data announcements would dictate terms in the equity market in a holiday-shortened week ahead, analysts said.


Equity markets would remain closed on Wednesday for Mahatma Gandhi Jayanti.

Click here to connect with us on WhatsApp


“Looking ahead, it will be interesting to monitor Foreign Institutional Investors (FIIs) and their flow into India. September saw the highest FII inflows into Indian equities this year. Movements in commodity prices, the US dollar index, and key macroeconomic data from the US will also be pivotal in shaping the market’s direction.


“Additionally, geopolitical developments will continue to be a key factor on the global stage,” said Santosh Meena, Head of Research, Swastika Investmart Ltd.


On the domestic front, upcoming monthly auto sales data and quarterly updates from companies could drive stock-specific movements in the near term, Meena said.


Among macroeconomic numbers, PMI (Purchasing Managers’ Index) data for the manufacturing and services sectors would influence trading in the markets.


“We expect the positive momentum to continue in the market driven by frontline stocks,” said Siddhartha Khemka, Head – Research, Wealth Management, Motilal Oswal Financial Services Ltd.


Last week, the BSE benchmark jumped 1,027.54 points or 1.21 per cent while the Nifty surged 388 points or 1.50 per cent.


The BSE Sensex hit a new record intra-day peak of 85,978.25 on Friday. The NSE Nifty also hit an all-time intra-day high of 26,277.35 on that day.


Going ahead, global factors will play a pivotal role, especially with the absence of any major domestic events, Ajit Mishra SVP, Research, Religare Broking Ltd, said.


“Auto sales data, set to be released from October 1, will be a key focus, along with important economic indicators such as HSBC India Manufacturing PMI and HSBC India Services PMI. Additionally, trends in foreign fund flows and crude oil price movements will be closely watched, as they could influence market sentiment,” Mishra said.


Vinod Nair, Head of Research, Geojit Financial Services, said, “Looking ahead, investors will be focusing on the Q2 earnings, with an anticipation of an improvement in earnings outlook.”

The market responded positively to the Fed’s rate cut and stable economic data points, which accelerated foreign inflows and generated momentum in domestic markets, Nair said.


Additionally, China’s economic stimulus announcement has bolstered investor confidence, resulting in notable positive momentum in global markets, particularly within Asian indices, he added.

(Only the headline and picture of this report may have been reworked by the Business Standard staff; the rest of the content is auto-generated from a syndicated feed.)

First Published: Sep 29 2024 | 10:13 AM IST


Source link

This Value Fund Has Just Completed 20 Years: Should You Invest?

This Value Fund Has Just Completed 20 Years: Should You Invest?


Equity markets are surging to new highs in recent months. Though there have been corrections in certain segments of the broader market, valuations still seem uncomfortably high for most indices.

As benchmarks rise and broader markets correct, a portfolio anchored in strong value-based stock-selection criteria may work well for investors. Even otherwise, for investors preferring the value style, a systematic approach over the long term is desirable.

As it celebrates 20 years since inception, ICICI Prudential Value Discovery fund may be a suitable choice for investors looking to create long-term wealth.

The scheme, which started operations in August 2024, has delivered a stellar 21.2 per cent return compounded annually over the past 20-plus years (regular plan). Despite occasional underperformance, the fund has consistently delivered robust performance over the years.

ICICI Prudential Value Discovery may be considered for the core of their portfolio by investors looking to stay put for 10 years or more. Investments that are made via the SIP route could be rewarding over longer timeframes.

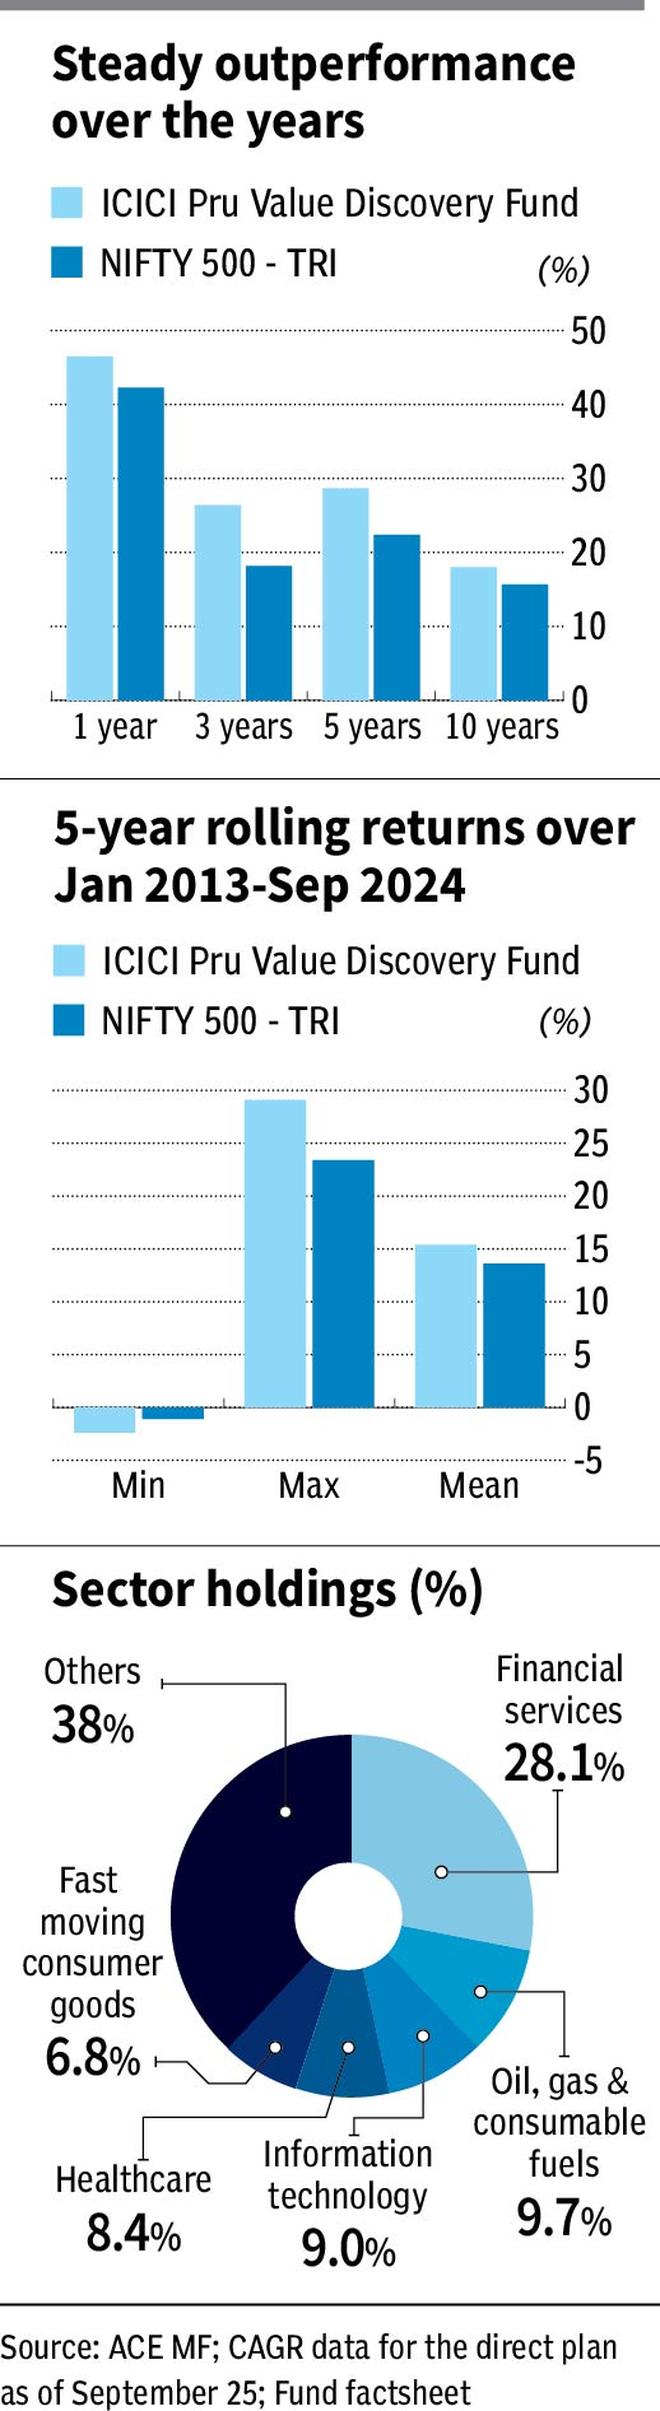
Delivering outperformance

The fund has been among the best performers across equity categories over the past couple of decades. It is also consistent in delivering returns.

Over the past 1-year, 3-year, 5-year and 10-year timeframes periods, the fund has delivered 46.5 per cent, 26.4 per cent, 28.7 per cent and 18 per cent, respectively on a point-to-point basis. This performance places it among the top performers across equity categories. The scheme outperformed the Nifty 500 TRI by 3-8 percentage points across time periods.

When five-year rolling returns over the past the period January 2013 to September 2024 are considered, ICICI Prudential Value Discovery has delivered mean returns of 15.4 per cent. In comparison, the Nifty 500 TRI delivered average returns of 13.6 per cent.

Also, in the period mentioned above, on a 5-year rolling basis, the scheme has beaten its benchmark Nifty 500 TRI over 63 per cent of the time, which is quite healthy. It has delivered more than 12 per cent over 76 per cent of the time over this period and more than 15 per cent over 50 per cent of the time.

The fund’s SIP returns (XIRR) over the past 10 years are top-notch, at 21.5 per cent. A SIP in its benchmark Nifty 500 TRI would have returned 18.7 per cent over the same period.

All return figures pertain to the direct plan of the fund.

ICICI Prudential Value Discovery has an upside capture ratio of 102.8, indicating that its NAV rises a bit more than the benchmark during rallies. But more importantly, it has a downside capture ratio of just 50.9, suggesting that the scheme’s NAV falls much less than the Nifty 500 TRI during corrections. A score of 100 indicates that a fund performs in line with its benchmark. These observations are based on data from September 2021-September 2024.

Value anchor

The fund has always had a large-cap bias in stock selection, with small portions of mid and small-caps thrown in. Often, the scheme has held 70 per cent of the portfolio or more in large-cap stocks, while occasionally dipping below that level. Even in the frenzied mid and small-cap rally of the past few years, ICICI Prudential Value Discovery has been careful about not going overboard on those segments.

The fund has for most part kept value at the centre of its portfolio churn. In late 2019 and early 2020, when IT, pharmaceutical and automobile stocks were beaten down, the fund increased stakes in these sectors, which rallied well subsequently. However, in the last 2-3 years, the fund has increased focus on banks and made them the top holdings in the fund. While IT and pharma stocks still figure among the top segments held, exposure has been somewhat trimmed from the post-COVID period. Exposure is generally taken to the top private or public sector names in any segment. With relatively better value present in a the large-cap space, the fund’s approach can be a relatively moderate-risk approach to return generation.

The fund has tended to maintain cash positions of 5-7 per cent. But in recent months, ICICI Prudential Value Discovery has increased the cash levels heavily – it is almost 13 per cent, according to the August portfolio.

As with all styles, value can underperform in phases that are too momentum driven, especially in one-way upward market rallies. However, patient accumulation can help over the long term.

Overall, the fund is suitable for an investor with a moderate risk appetite, looking to create long-term wealth.


Source link

Mutual Funds: Does Past Performance Indicate How They’ll Perform in the Future?

Mutual Funds: Does Past Performance Indicate How They’ll Perform in the Future?


The capital markets regulator SEBI mandates that all mutual funds (MFs) disclose their track record of performance in a specified format. Ironically (or maybe not), it also requires all MF documents to include a disclaimer that states past performance is not an indicator of future returns. Most advisors and analysts in the industry, as well as reputed industry publications, platforms and databases, use this as a key, if not the most important metric, in evaluating a fund. And why not? If a fund manager has skills to identify trends, forecast estimates and pick stocks better, they should be able to outperform peers reasonably continuously. But, in reality, can we rely on historical outperformance to foretell future returns?

To test this, we carried out an in-depth analysis across large-, mid- and small-cap funds and the findings were incredibly surprising. We used the six largest funds across categories to ensure we had sufficient data for a 10-year period. For every trading day, we ranked the funds based on the performance of the last three years and then performed a Spearman’s rank correlation test with the returns provided over the next three years. The Spearman’s correlation coefficient measures how well the past returns correlate with future performance. A value greater than 0.5 indicates that it is a good predictor, while a negative value means that it’s not.

There were a total of 978 days of data points with both a history and a post-investment period of three years. The distribution of Spearman’s coefficient was as follows:

For nearly 72 per cent of the total days, for large-caps, investors would be better off choosing an underperforming fund compared with an outperformer. For mid- and small-caps, this is even starker (93 per cent and 80 per cent respectively).

If an investor had adopted a daily SIP approach over the last 10 years, her optimal choice would have been an underperforming fund rather than a leader. Suppose an investor had invested ₹1,000 every day over the last seven years (after the first three-year return data over the 10-year period became available) in the worst performing of the six large-cap funds, he would have nearly ₹3.8 lakh more today when compared with the best performing fund. And unsurprisingly, this holds good for mid- and small-cap funds as well.

Performance shift

All this begs the question: Why should there be such dramatic shifts in the performance of different funds? As this phenomenon has been witnessed over time periods and across different segments, there is a high probability that this is not just coincidence but there are causal factors impacting their performance.

One possible reason is that fund managers have different strategies.

And when business cycles and markets turn, different sectors and themes tend to be winners. Therefore, funds which had over owned these winners would have underperformed in the past but would consequently do better in the future.

Another reason, and this can work alongside the first, is that outperforming fund managers generally tend to hold on to their winners a bit too long.

After all, it is very difficult for an asset manager to sell their best stocks after just a quarter or two of unfavourable macro data or poor results.

Especially, if this stock had given them superlative returns over long periods! And this can end up costing these schemes dearly as the stock price corrects.

So, how can investors decide on the optimal fund to invest?

It may be easy to infer from the above analysis that it is better to invest in a fund that has a poor track record recently. Apart from being counter intuitive, this approach completely discards the ability of a fund manager as a factor. A better approach would be to understand the investment strategy and holding philosophy of the manager. This is typically obtained through interactions over webinars organised by these MFs, periodic newsletters and direct communications. Investors can then overlay this on the current holding pattern of the fund and how it has evolved over a period. If investors find this too daunting and time consuming, they can rely on qualified advisors, who would be tracking this.

The author is a SEBI registered investment advisor and is the founder of Investreet Advisors. The views are the author’s and does not reflect the opinion of bl.portfolio


Source link

YouTube
Instagram
WhatsApp