Sensex, Midcap, Smallcap, Sectors: What they don’t tell you about mutual fund SIPs

Sensex, Midcap, Smallcap, Sectors: What they don’t tell you about mutual fund SIPs


First brought in as a concept more than three decades ago, SIP, or systematic investment plan, today has virtually become the comfort food Indian investors binge monthly. In April 2026 alone, more than ₹31,000 crore flowed into mutual funds through SIPs across over 10 crore accounts. For full FY26 (April 2025 to March 2026), SIP contributions (gross) stood at nearly ₹3.5 lakh crore — over eight times the level seen a decade ago. That tsunami of mostly retail investor money has helped Indian markets absorb the massive ₹1.8-lakh crore sale of equities by foreign portfolio investors last fiscal.

None of this makes the SIP faith irrational. Discipline over two decades has indeed produced many rags-to-riches stories. But the journey and the outcome has not been equally rewarding for everyone.

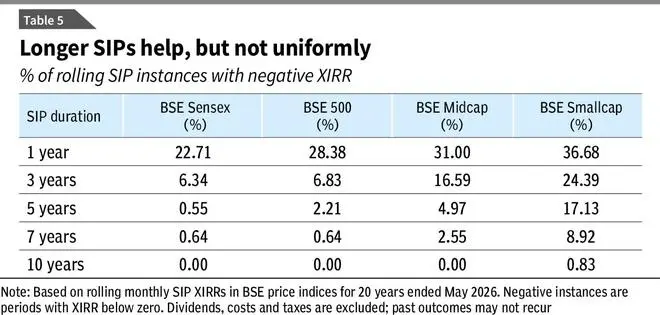
That unevenness is not merely theoretical. Over one-third of the two-year SIPs in mutual fund schemes across market-cap categories are currently showing losses. SIP discipline remains useful, but it is not a 100 per cent autopilot route to wealth. Returns depend not only on staying invested, but also on where one invests, when the SIP begins and how markets behave along the way. Time can heal many market wounds, but it cannot be blindly assumed to rescue every poor outcome.

SIP may have become India’s default investing habit. But, a mere fund SIP does not create returns; it simply distributes entry points for your monthly investments. What SIP return investors finally earn depends on the sequence of prices, the portfolio chosen and whether the exit value is high enough to reward the units accumulated over time.

In this article, we focus on the other side of the SIP story for equity funds. Why? Because a proactive investor in today’s dynamic world can no longer afford to outsource their financial awareness to a system incentivised by assets rather than absolute outcomes. Distributors earn trail commissions to keep your capital parked, while fund managers are strictly bound by mandates to deploy your monthly SIP inflows, even when they may know the broader market is severely overvalued.

This apparent conflict of interest actively champions “lazy investing.” A “fill it, shut it, forget it” approach is a dangerous luxury in a hyper-evolving world where rapid technological shifts, such as AI, are aggressively rewriting business models and market cycles.

Understanding SIPs

By now most investors know that when markets fall, each SIP buys more units; when markets rise, each SIP buys fewer units. For instance, a ₹10,000 SIP buys 100 units at a NAV of ₹100, but 125 units if the NAV falls to ₹80. Over time, investors hope they have accumulated mutual fund units at a relatively lower average cost. But, this is assuming markets swing up and down rather than only rising steadily. This way, SIP smooths out timing risk, letting build their portfolio steadily instead of trying to pick the perfect moment to invest all at once.

In a mutual fund SIP, the investor is not buying the units at the same price every month. She is buying units at different prices (NAVs), as the price of the underlying securities change. The return (XIRR) is, therefore, not merely a function of where the buying starts and ends. It is a function of every purchase price in between. This is why two SIPs with similar point-to-point returns can produce different return (XIRRs).

The message marketed to investors is simple — markets may be volatile, but SIPs will take care of wealth creation if they mute the noise and ignore the ups and downs. Such messages are useful, but they are also incomplete.

But make no mistake, doing a SIP is nothing close to a return promise, even if SIP calculators can make you feel there is a finality in their theoretical projections.

At the end of the day, SIP is just a cash-flow method. A monthly SIP can produce very different results depending on when the market falls, and when it rises. For instance, a strong multi-year rally in the Sensex during a five-year SIP can result in compounding at nearly 19.75 per cent XIRR, as in the 2016-21 cycle.

By contrast, high starting valuations followed by a market correction just as the five-year SIP matured deflated returns to a modest 6 per cent XIRR, as seen in 2021-26 period ended May 20. And if a severe crash hits right at the end, it can temporarily leave a negative -2.6 per cent XIRR for a five-year Sensex SIP, as in 2015-20 period.

In other words, the same disciplined habit — same monthly “debits,” same cash invested can look like a windfall in one cycle, mediocre in another and disappointing in a third. The difference isn’t the investor; it’s the path the market took.

The problem is not SIP. In fact, the problem is the mythology built around it. Yes, SIPs reduce timing regret. But, they do not remove market risk, valuation risk, category risk or the danger of chasing yesterday’s fund/index winners. They can make bad timing less painful, but they cannot make every entry point wise.

Market decides SIP path

To show how market-swings shape SIP outcomes, we modelled a ₹10,000 monthly investment in the Sensex over five years. We illustrate four hypothetical contrasting market paths: A sharp early dip followed by a recovery, a steady growth trajectory, a flat market with late gains and a strong early rally (see TABLE 1).

As you would notice, each path results in drastically-different final portfolio values and annualised returns (XIRR), ranging from 2.8 per cent to 10.9 per cent. This is despite identical cash flows and the exact same starting and ending index levels.

These examples underscore a critical reality. While SIPs smooth out entry timing, they cannot neutralise sequence-of-returns risk. The path the market takes largely decides whether disciplined investing feels like a windfall, a steady gain or a disappointment.

The projections assume a cumulative index growth of 50 per cent over five years (target ending Sensex: 112,977), an approximate PE ratio of 18 at end of the fifth year vs current starting PE of about 20, and annualised earnings growth of 10-12 per cent. To map these market levels to a realistic mutual fund structure, the index was scaled down to represent a base Unit NAV (for example, 75,318 translates to a starting NAV of ₹75.32).

Using AI modelling, we selected four illustrative market paths from countless possibilities, each reaching the same endpoint.

Crisis: An early, severe drop resulting in a 27.0 per cent maximum drawdown, followed by extended stagnation and a late recovery.

Steady upside: A smooth, linear rise interrupted only by minor 4.5 per cent corrections.

Flattish: Minimal overall growth for years, featuring an 8.0 per cent mid-cycle slump, before a sudden jump at the very end of the tenure.

Strong rally: Rapid, front-loaded growth causing an immediate NAV spike, followed by a prolonged plateau and a mild 2.5 per cent correction.

Distribution of SIP returns

The aforementioned theoretical scenarios prove that the market’s path dictates your return. But what paths have Indian equities historically taken? To move from theory to empirical evidence, we ran rolling historical SIP returns across different market caps and themes over the last 20 years ended May 20, 2026.

We tested five-year, seven-year and 10-year SIP horizons (see TABLE 2).

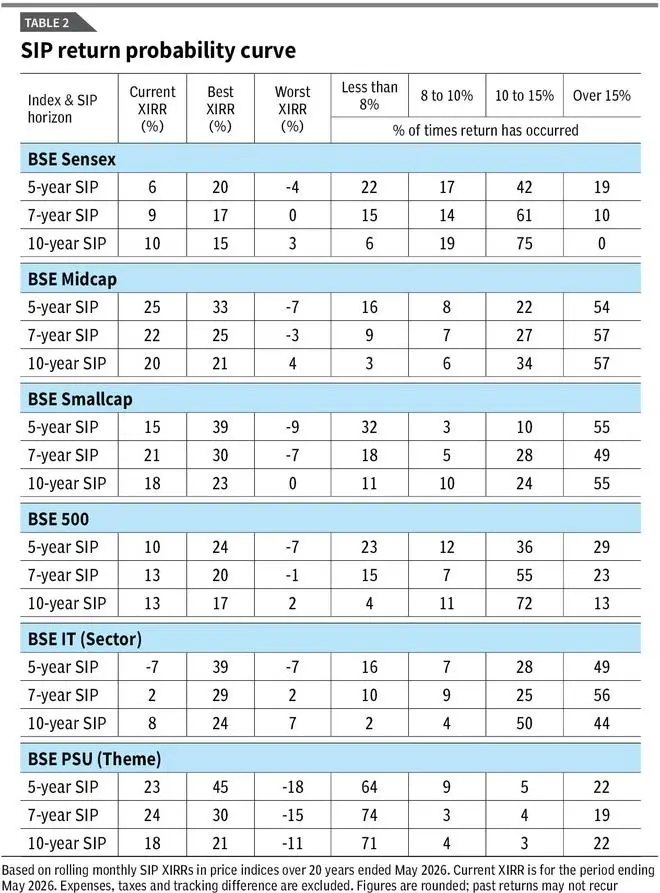
The results show a massive dispersion in outcomes. The real question is not whether SIPs made money once, but where most outcomes clustered and how bad the downside became.

The width of the SIP probability curve tells the real story.

* Time heals broad markets, but kills the windfall: The data validates the core tenet of long-term investing, provided you stick to broad indices. Notice how extending a Sensex SIP from five to 10 years acts as a powerful volatility shock absorber. The ‘less than 8 per cent XIRR’ possibility shrinks dramatically from 22 per cent down to just 6 per cent. However, time also actively crushes upside variance. Over a rolling 10-year period, the historical probability of earning a massive Sensex windfall (>15 per cent) collapsed to zero

* The fat tails of small-caps: Stepping outside the large-cap safety net exposes investors to a much-wider dispersion of destinies. A five-year small-cap SIP is the ultimate coin toss. Historically, there was a 55 per cent chance of a phenomenal windfall, paired directly with a 32 per cent chance of landing in the ‘less than 8 per cent’ zone. More importantly, time does not heal small-caps as perfectly as large caps. historical small-cap SIPs still faced a 11 per cent risk of sub-8 per cent returns, with the absolute worst-case scenario remaining in break-even territory (0 per cent).

* The thematic trap: Perhaps the most crucial takeaway lies in the thematic divergence. The standard industry advice is to “give it more time” when an equity SIP is underperforming. For highly-cyclical themes, this advice can be fatal. Look at the BSE PSU matrix. Over a fiveyear horizon, 64 per cent of SIPs landed in the sub-8 per cent XIRR zone. When investors extended their horizon to 10 years, hoping time would bail them out, the sub-8 per cent return actually expanded to 71 per cent. After 120 months of averaging down, the absolute worstcase scenario remained negative (-11 per centXIRR).

Our probability matrix shows that while a decade of patience might save a Sensex investor, it can actively destroy capital in cyclical or thematic funds. This exposes the ultimate flaw of “lazy investing.” If your SIP has compounded brilliantly over five-seven years, especially in a mid-cap, small-cap or sector/thematic fund, leaving that ballooned corpus entirely at the mercy of the market is mathematically reckless. Sectors revert to the mean violently, and as historical data show, massive windfalls can evaporate if you overstay the cycle. Negative SIP return instances, though infrequent, do happen even in case of broad-market stock baskets (see Table 5).

Returns you cannot SIP

The danger of sector/thematic investing isn’t just about picking the wrong sector. It is actually about picking the right basket at the exact wrong time. An explosive half-decade growth creates the illusion of a permanent structural shift. But a new SIP doesn’t buy the last five years, it buys the next five. And the next five are usually governed by a brutal law of financial physics called ‘mean reversion’.

While the mutual fund industry may not have had a dedicated thematic fund for every single micro-sector back in 2008 or 2011, the underlying index data reveal exactly how these market cycles behaved. Our analysis maps the absolute peak of five-year trailing returns for each sector between 2011 and 2021, and tracks what happened to fresh SIP money over the subsequent 60-month window.

Look at the BSE Auto index. At its peak euphoria in December 2013, investors stared at a staggering 39 per cent five-year CAGR. But an investor starting a five-year SIP on that exact date suffered through a cyclical winter, generating a pathetic 1-2 per cent XIRR on their fresh money. This was because much of the money was invested at elevated levels in 2017–18, just before the index fell sharply near the end date.

The cyclical value traps are even more destructive. Investors who saw a respectable 11.7 per cent trailing 5-year CAGR return in PSUs in June 2011 and blindly started a SIP ended up actively destroying their wealth, yielding a -2 per cent return over the next 60 months. The Power and Oil & Gas sectors mirrored this exact trends.

Yes, there are exceptions too such as Capital Goods and Industrials. They prove that if a new earnings cycle perfectly aligns with momentum, returns can persist. Whereas in themes like IT, FMCG, and Financial Services, a peaking trailing return reliably signalled that the easy money had already been made.

SIPs are often treated as a behavioural cure-all. They are not. SIP fixes the habit problem. It does not fix the entry-price problem. It ensures regular investing. It does not ensure that the chosen category is still attractively placed.

First takeaway is that a SIP in a diversified equity fund is not the same as a SIP in a narrow sector/thematic fund. A SIP started after a broad market correction is not the same as a SIP started after a euphoric category rally. The debit may be identical every month; the risk being bought is not.

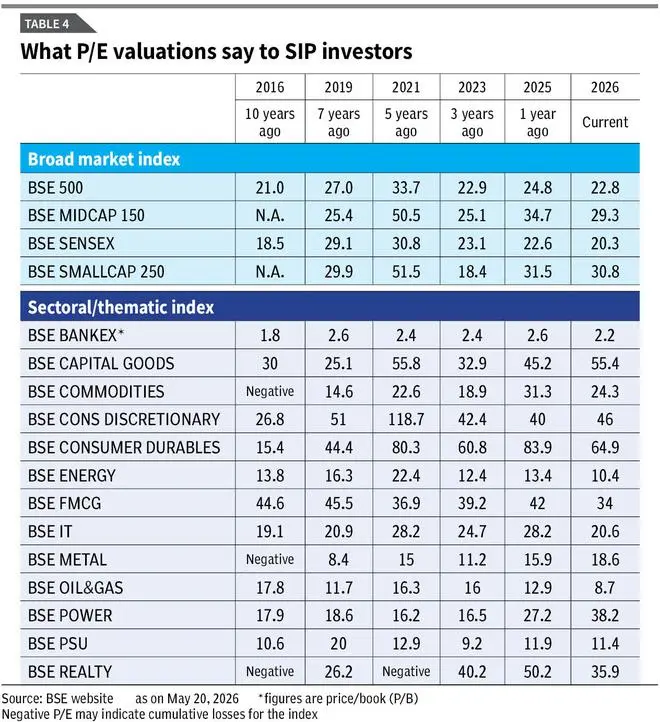
This brings to our second takeaway. We do not say that investors should avoid strong-performing categories. That would be too simplistic. The real lesson is that trailing returns should trigger questions, not commitment. What drove the return? Was it earnings growth, valuation expansion (see TABLE 4), policy excitement, liquidity or a temporary cycle? Has the index or category already doubled from its lows? Is the SIP being used to build long-term allocation, or to chase a hot table?

A top-5/10 SIP performers table is useful evidence of what has worked. It is poor evidence of what will work next.

Knowing when to book profit, shift gains

Warren Buffett has emphasised his investment decisions which appear sudden are usually the result of a framework built over years: Clarity on why one is buying, what would change the thesis and when one should act. SIP investors need a similar discipline. A SIP can remain the route to accumulation, but it should not become an excuse for investing without a destination or review plan. Before starting, define the goal, time horizon, asset allocation and conditions for rebalancing or shifting accumulated gains through an STP. In euphoric or panic-driven markets, such a framework prevents both blind continuation and impulsive exit.

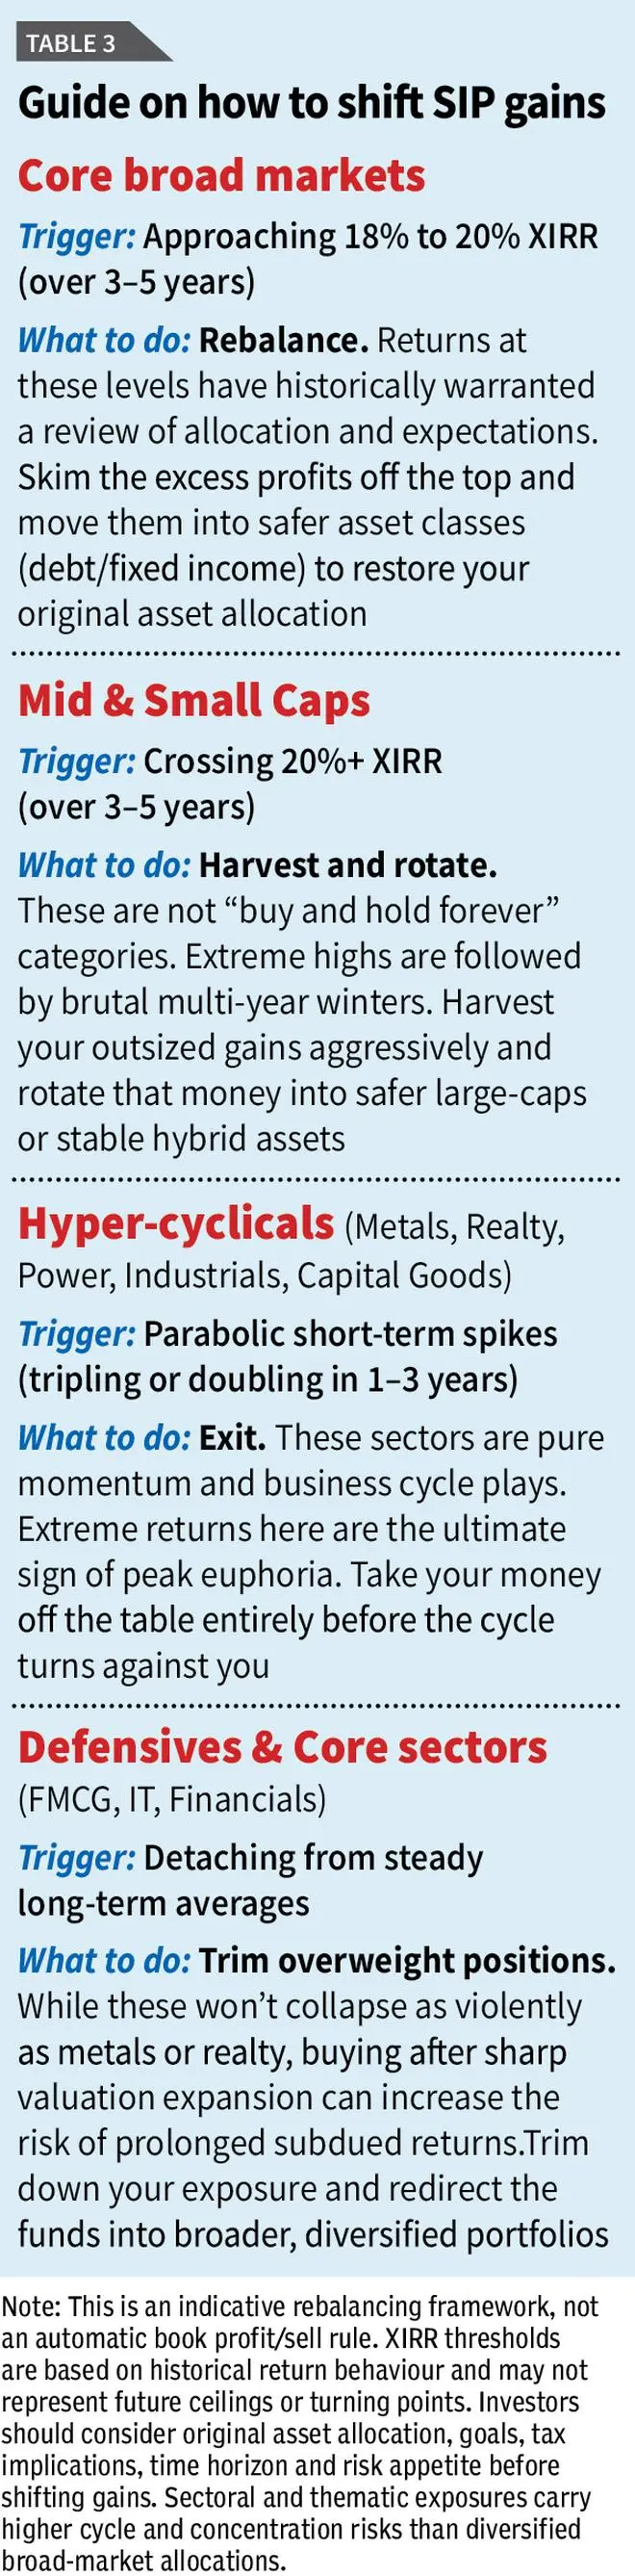
When we map out over two decades of rolling SIP returns across broad, sectoral and thematic indices, a system emerges (see TABLE 3).

Exceptional returns are rarely a sign of permanent structural growth; they are almost always a signal of peak cyclical euphoria. Crucially, the data prove that when extreme returns flash, the culprits are usually sectoral indices, not the broad market.

While broad indices have strict historical speed limits, sectors can experience dizzying, unsustainable peaks. For example, the highest-ever five-year SIP return for BSE Industrials hit 54.6 per cent, and BSE Realty reached 48.8 per cent.

Broad market SIPs require a completely different set of rules. Because highly-diversified funds represent the broader economy, their historical ceilings are much lower. The data confirm that broad markets (Sensex, BSE 500) almost never breached a 25 per cent XIRR over a five-year period. 

Because of these hard historical ceilings, the “euphoria zone” for a large-cap or flexi-cap SIP sits squarely between 18 per cent and 20 per cent. Over the last two decades, whenever a five-year SIP in the Sensex or BSE 500 breached the 18 per cent mark, it reliably signalled a market top. If your core equity portfolio hits this number, it is your mathematical signal to stop hoping for more and execute a standard asset-allocation rebalance, sweeping excess equity profits into safer places.

Mid- and small-cap funds carry a much harsher penalty because they behave almost exactly like the highly-volatile thematic sectors. Their historical peaks soar far above the broad market: The absolute highest five-year SIP return for the BSE Smallcap reached a staggering 39 per cent, while the BSE Midcap hit 33 per cent.

Because they are capable of such extreme highs, the cyclical winters that follow are unforgiving. Our historical backtesting shows that when a five-year SIP in a mid- or small-cap index simply crossed the 20 per cent threshold, the median forward three-year return from that exact moment was quite low. So when they deliver outsized 20 per cent+ returns over half a decade, even if they haven’t hit their absolute historical maximums, it is a mandate to harvest those gains and rotate into calmer waters.

Published on May 23, 2026


Source link

Why This Nifty 50-Midcap-Smallcap Mix Crushes the Nifty 500

Why This Nifty 50-Midcap-Smallcap Mix Crushes the Nifty 500


Passive investing is gathering momentum in India, with investors increasingly weighing index strategies to identify the most efficient route to long-term wealth creation. The Nifty 500, which covers about 92 per cent of listed market capitalisation on the NSE, serves as a broad proxy for the equity market. For many, a single index fund or exchange traded fund (ETF) tracking the Nifty 500 offers a simple, low-maintenance way to gain diversified exposure.

Yet, a bl.portfolio analysis shows that a structured mix of the Nifty 50, Nifty Next 50, Nifty Midcap 150 and Nifty Smallcap 250 can deliver superior long-term outcomes compared to the Nifty 500 alone. Based on 10-year rolling return data over the last 20 years, the Nifty 500 TRI generated an average CAGR of 12.7 per cent. An equal-weight allocation across the four indices, however, delivered about 14.3 per cent. This indicates an outperformance of 1.60 percentage points that can meaningfully enhance long-term compounding.

For investors starting early, a simple equal allocation across these indices offers exposure across the full market-cap spectrum of large-, mid- and small-caps.

Large-cap bias

The limitation of the Nifty 500 lies in its construction. As of April 2026, nearly 57 per cent of the index weight is concentrated in the Nifty 50, with the Nifty Next 50 accounting for another 13 per cent. Mid-caps and small-caps together account for just 30 per cent, at 20 per cent and 10 per cent respectively. In effect, close to 70 per cent of the index is tilted towards the top 100 companies — large-caps.

While this bias lends stability, it also skews the portfolio towards mature businesses where earnings growth may taper over time. In an emerging market like India, mid-sized and emerging companies often contribute alpha, capturing incremental growth beyond large, mature firms.

This skew towards large-caps of Nifty 500 is inherent to the free-float market-cap methodology. Because the Nifty 500 weights stocks by free-float market capitalisation, larger companies automatically get a bigger share, creating a built-in large-cap tilt. But for investors seeking true market-wide participation, such concentration can act as a structural drag.

A multi-index allocation helps address this imbalance by distributing exposure more evenly across market segments.

Why a combination works

The advantage of this Nifty 50-Next 50-Midcap-Smallcap mix shows up not just in returns, but in sector spread and risk management.

Broader sector play: A comparison of sector weights reveals meaningful differences. As of April 2026, banking accounts for 19.5 per cent of the Nifty 500, versus 12.3 per cent in the equal-weight combination, reflecting the index’s heavy dependence on large banks. The combination, however, allocates more to broader financials at 11.4 per cent against 8.8 per cent. This captures NBFCs, microfinance and fintech players that are better represented in mid- and small-cap segments. Similarly, the combination carries higher exposure to capital goods at 6.4 per cent against 4.4 per cent, healthcare at 8.2 per cent against 6.6 per cent, automobiles and ancillaries at 10 per cent against 8.4 per cent, and power at 4.7 per cent against 4 per cent. These sectors are closely aligned with India’s domestic growth narrative involving manufacturing, infrastructure and consumption. One can argue that Nifty 500 remains tilted towards more established, old-economy and export-oriented businesses. Additionally, sectors such as business services, education & training, media & entertainment and plastic products barely exist in the Nifty 500’s effective weight. The combination strategy brings these sectors into the portfolio mix.

Better risk management: Unlike the Nifty 500, where large-caps dominate by default, the combination approach allows investors to consciously set their exposure. An equal 25 per cent allocation balances stability with growth by anchoring the portfolio in large-caps, while ensuring meaningful participation in mid- and small-caps. More aggressive investors can increase their exposure to mid- and small-cap indices during favourable cycles, while conservative investors may tilt toward the Nifty 50 and Next 50. Also, unlike market-cap weighted indices that automatically increase exposure after rallies, a combination strategy creates a disciplined rebalancing framework. Indian equities exhibit clear cyclical leadership. Large-caps tend to outperform during global risk-off phases, mid-caps during steady domestic growth, and small-caps in liquidity-driven rallies. The bl.portfolio long-term asset allocation grid, too, reflects this trend. A multi-index strategy automatically captures this rotation, improving returns across cycles. No single segment leads indefinitely; the advantage lies in systematic participation across them.

Takeaways

Around 10 passive funds currently track the Nifty 500 and BSE 500, managing over ₹5,500 crore. While the Nifty 500 remains a convenient and broadly diversified benchmark, its inherent large-cap bias may constrain its effectiveness for long-term, market-wide participation.

A combination approach spanning the Nifty 50, Nifty Next 50, Nifty Midcap 150 and Nifty Smallcap 250 offers a more nuanced alternative. It reduces concentration risk, enhances sectoral breadth and gives investors greater control over allocation and rebalancing.

Also, comparing the yearly returns over the last 20 years shows that the combination strategy outperformed the Nifty 500 in 12 out of 20 periods.

This multi-index approach helps long-term investors earn steadier returns through market ups and downs.

That said, a multi-index combination is more complex than a single index, requiring monitoring, rebalancing and awareness of overlapping exposures. Trading costs, liquidity constraints in smaller indices, short-term underperformance during large-cap rallies, sector concentration and limited historical coverage of extreme events mean disciplined rebalancing is essential.

Published on May 23, 2026


Source link

Mutual Funds returns

Mutual Funds returns


EQUITY – LARGE & MID CAP FUNDS

Bandhan Large & Mid Cap Fund

5

138.2

16672

1.4

0.4

7.3

22.7

18.1

16.3

0.58

HYBRID – AGGRESSIVE HYBRID FUNDS

BOI AXA Mid & Small Cap Eq&Debt

5

40.4

1482

1.8

0.7

8.7

20.1

16.8

0.48

HYBRID – BALANCED ADVANTAGE FUNDS

Baroda BNP Paribas Balanced Advantage

5

25.2

4756

1.6

0.6

6.3

13.4

11.4

0.44

EQUITY – LARGE CAP FUNDS

Canara Robeco Large Cap Fund

5

59.6

16542

1.4

0.5

-3.8

11.5

10.5

13.7

0.33

EQUITY – TAX SAVING (ELSS) FUNDS

DSP ELSS Tax Saver Fund

5

135.0

16337

1.4

0.6

-1.7

16.7

14.0

15.6

0.45

HYBRID – EQUITY SAVINGS FUNDS

Edelweiss Equity Savings Fund

5

26.4

1313

2.1

1.2

6.8

10.8

9.1

9.2

0.71

EQUITY – MID CAP FUNDS

Edelweiss Mid Cap Fund

5

105.5

15911

1.8

0.6

9.0

24.4

20.1

18.9

0.58

HYBRID – BALANCED ADVANTAGE FUNDS

HDFC Balanced Advantage Fund

5

508.2

105378

1.3

0.7

-0.6

14.7

15.2

15.0

0.75

EQUITY – FLEXI CAP FUNDS

HDFC Flexi Cap Fund

5

1945.7

100479

1.3

0.7

0.3

18.1

17.8

16.6

0.65

EQUITY – LARGE & MID CAP FUNDS

HDFC Large and Mid Cap Fund

5

332.6

28255

1.6

0.8

1.2

17.2

16.5

15.2

0.53

EQUITY – MID CAP FUNDS

HDFC Mid Cap Fund

5

199.1

94745

1.3

0.7

6.8

22.7

20.3

18.2

0.66

EQUITY – VALUE FUNDS

HSBC Value Fund

5

111.2

14873

1.7

0.7

5.2

20.6

18.0

16.6

0.56

EQUITY – DIVIDEND YIELD FUNDS

ICICI Prudential Dividend Yield Equity Fund

5

52.4

6458

1.8

0.6

2.6

19.7

19.5

16.3

0.73

HYBRID – AGGRESSIVE HYBRID FUNDS

ICICI Prudential Equity & Debt Fund

5

396.5

50368

1.5

1.0

3.1

16.7

16.9

15.8

0.79

EQUITY – LARGE & MID CAP FUNDS

ICICI Prudential Large & Mid Cap Fund

5

994.8

29757

2.0

1.2

1.3

18.4

18.0

16.0

0.65

EQUITY – LARGE CAP FUNDS

ICICI Prudential Large Cap Fund

5

106.1

75650

1.7

1.2

-1.8

14.5

13.7

14.3

0.48

EQUITY – SECTOR – PHARMA FUNDS

ICICI Prudential P.H.D Fund

5

41.8

6669

2.4

1.6

9.5

29.0

16.1

0.56

HYBRID – CONSERVATIVE HYBRID FUNDS

ICICI Prudential Regular Savings Fund

5

77.7

3289

1.7

1.0

3.8

9.3

8.4

9.3

0.85

EQUITY – VALUE FUNDS

ICICI Prudential Value Fund

5

458.3

59588

1.6

1.2

-0.1

17.0

17.1

15.4

0.68

EQUITY – FLEXI CAP FUNDS

JM Flexicap Fund

5

93.7

5041

2.6

1.4

-2.6

17.7

16.5

16.7

0.49

HYBRID – CONSERVATIVE HYBRID FUNDS

Kotak Debt Hybrid Fund

5

58.3

2902

1.7

0.5

-0.3

8.2

7.9

8.9

0.61

EQUITY – THEMATIC – CONSUMPTION FUNDS

Nippon India Consumption Fund

5

181.9

2443

2.0

0.7

-6.6

12.0

14.3

12.9

0.45

EQUITY – LARGE CAP FUNDS

Nippon India Large Cap Fund

5

87.9

51690

3.5

2.8

0.0

14.9

15.7

15.0

0.54

EQUITY – SMALL CAP FUNDS

Nippon India Small Cap Fund

5

172.7

72673

1.4

0.7

5.8

20.0

21.2

21.0

0.57

EQUITY – FLEXI CAP FUNDS

Parag Parikh Flexi Cap Fund

5

82.5

140950

1.1

0.5

0.4

15.8

15.0

17.2

0.58

HYBRID – AGGRESSIVE HYBRID FUNDS

Quant Aggressive Hybrid Fund

5

451.0

2024

2.1

0.8

9.9

14.7

13.7

15.7

0.47

EQUITY – TAX SAVING (ELSS) FUNDS

Quant ELSS Tax Saver Fund

5

387.6

12506

1.8

0.8

10.1

17.9

16.0

19.4

0.44

EQUITY – MID CAP FUNDS

Quant Mid Cap Fund

5

219.0

7905

2.9

1.8

1.1

18.1

17.0

17.1

0.48

EQUITY – SMALL CAP FUNDS

Quant Small Cap Fund

5

262.1

30374

2.0

1.1

5.5

20.3

20.1

19.1

0.50

EQUITY – TAX SAVING (ELSS) FUNDS

SBI ELSS Tax Saver Fund

5

425.9

31094

1.6

1.0

-0.4

19.5

17.3

14.9

0.57

EQUITY – SECTOR – IT FUNDS

SBI Technology Opportunities Fund

5

185.9

4240

1.9

0.9

-11.3

9.4

10.5

15.1

0.27

HYBRID – EQUITY SAVINGS FUNDS

Sundaram Equity Savings Fund

5

69.9

1079

2.2

0.8

0.8

9.3

9.3

9.2

0.54

EQUITY – SECTOR – BANKING FUNDS

Sundaram Financial Services Opportunities Fund

5

103.3

1613

2.1

0.8

0.8

14.2

13.3

14.7

0.40

HYBRID – BALANCED ADVANTAGE FUNDS

Aditya Birla SL Bal Advantage

4

108.3

9182

1.5

0.6

3.7

11.7

9.8

10.9

0.51

EQUITY – LARGE & MID CAP FUNDS

Axis Large & Mid Cap Fund

4

33.1

15582

2.0

0.9

5.7

16.6

14.3

0.40

EQUITY – SMALL CAP FUNDS

AXIS Small Cap Fund

4

106.5

27364

1.7

0.7

4.3

16.7

16.9

18.3

0.52

EQUITY – TAX SAVING (ELSS) FUNDS

Bandhan ELSS Tax Saver Fund

4

149.6

6835

1.6

0.6

0.8

12.5

12.8

14.8

0.41

EQUITY – VALUE FUNDS

Bandhan Value Fund

4

143.3

9907

1.5

0.6

-1.2

13.6

14.8

15.4

0.48

EQUITY – TAX SAVING (ELSS) FUNDS

Bank of India ELSS Tax Saver

4

160.3

1403

1.8

0.8

1.6

15.9

13.9

16.1

0.38

EQUITY – SMALL CAP FUNDS

Bank of India Small Cap Fund

4

49.7

2168

1.7

0.5

11.1

21.1

19.2

0.48

HYBRID – AGGRESSIVE HYBRID FUNDS

Baroda BNP Paribas Aggressive Hybrid Fund

4

27.5

1239

1.9

0.5

0.4

12.5

10.5

0.39

EQUITY – THEMATIC – CONSUMPTION FUNDS

Baroda BNP Paribas India Consumption Fund

4

29.1

1419

1.8

0.6

-5.0

11.6

11.7

0.35

EQUITY – THEMATIC – CONSUMPTION FUNDS

Canara Robeco Consumption Fund

4

102.5

1901

1.8

0.7

-4.2

12.1

12.5

15.4

0.36

EQUITY – TAX SAVING (ELSS) FUNDS

Canara Robeco ELSS Tax Saver

4

172.9

8529

1.5

0.6

0.9

13.1

11.8

14.8

0.38

EQUITY – SECTOR – PHARMA FUNDS

DSP Healthcare Fund

4

40.8

3142

1.7

0.5

9.4

23.2

14.2

0.43

HYBRID – AGGRESSIVE HYBRID FUNDS

Edelweiss Aggressive Hybrid Fund

4

63.3

3627

1.9

0.5

1.9

14.6

13.6

12.7

0.57

HYBRID – BALANCED ADVANTAGE FUNDS

Edelweiss Balanced Advantage Fund

4

51.5

12906

2.1

1.0

3.3

11.0

9.7

11.0

0.43

EQUITY – FLEXI CAP FUNDS

Edelweiss Flexi Cap Fund

4

37.7

3320

1.9

0.5

2.7

16.1

13.9

15.0

0.43

EQUITY – DIVIDEND YIELD FUNDS

Franklin India Dividend Yield Fund

4

136.1

2306

1.7

1.1

-1.7

14.7

15.3

15.5

0.60

EQUITY – FLEXI CAP FUNDS

Franklin India Flexi Cap Fund

4

1547.1

19049

1.4

0.8

-4.0

14.9

14.0

13.4

0.44

EQUITY – TAX SAVING (ELSS) FUNDS

HDFC ELSS Tax saver

4

1325.0

15559

1.7

1.1

-4.0

16.5

16.8

14.2

0.60

HYBRID – EQUITY SAVINGS FUNDS

HDFC Equity Savings Fund

4

66.4

5718

1.9

0.9

2.1

8.7

8.4

9.6

0.57

HYBRID – CONSERVATIVE HYBRID FUNDS

HDFC Hybrid Debt Fund

4

82.0

3261

1.7

1.2

-0.5

7.8

8.1

8.6

0.69

EQUITY – LARGE CAP FUNDS

HDFC Large Cap Fund

4

1084.3

38121

1.5

1.0

-2.9

11.8

12.4

13.3

0.42

HYBRID – BALANCED ADVANTAGE FUNDS

ICICI Prudential Balanced Advantage Fund

4

75.5

70551

1.4

0.9

4.2

11.7

10.6

11.2

0.63

EQUITY – SECTOR – IT FUNDS

ICICI Prudential Technology Fund

4

169.5

13068

2.1

1.4

-13.0

8.3

8.3

15.2

0.21

EQUITY – SECTOR – BANKING FUNDS

Invesco India Financial Services Fund

4

141.7

1673

1.8

0.7

7.1

18.3

14.5

15.8

0.41

EQUITY – MID CAP FUNDS

Invesco India Midcap Fund

4

182.7

11767

1.5

0.5

10.6

25.2

20.3

18.6

0.55

EQUITY – SMALL CAP FUNDS

Invesco India Smallcap Fund

4

42.4

11038

1.5

0.4

7.5

22.7

20.2

0.55

HYBRID – AGGRESSIVE HYBRID FUNDS

JM Aggressive Hybrid Fund

4

113.9

701

2.9

1.4

-2.5

15.5

13.1

12.1

0.46

EQUITY – TAX SAVING (ELSS) FUNDS

JM ELSS Tax Saver Fund

4

47.5

220

2.6

1.3

2.9

16.7

14.6

15.9

0.43

EQUITY – LARGE CAP FUNDS

JM Large Cap Fund

4

147.8

422

2.8

1.3

-0.4

12.7

11.8

11.2

0.35

HYBRID – AGGRESSIVE HYBRID FUNDS

Kotak Aggressive Hybrid Fund

4

62.9

8642

1.8

0.5

4.8

13.8

12.3

13.1

0.47

HYBRID – EQUITY SAVINGS FUNDS

Kotak Equity Savings Fund

4

26.9

10032

1.7

0.7

5.0

10.3

9.6

9.3

0.68

EQUITY – LARGE CAP FUNDS

Kotak Large Cap Fund

4

547.4

10599

1.7

0.7

-2.4

12.0

11.1

12.6

0.35

EQUITY – MID CAP FUNDS

Mahindra Manulife Mid Cap Fund

4

35.2

4688

1.6

0.4

9.8

23.8

19.2

0.55

EQUITY – TAX SAVING (ELSS) FUNDS

Mirae Asset ELSS Tax Saver Fund

4

48.7

25267

1.4

0.6

3.4

15.2

12.7

17.1

0.39

HYBRID – EQUITY SAVINGS FUNDS

Mirae Asset Equity Savings Fund

4

20.8

1918

1.2

0.3

4.3

10.2

9.0

0.55

EQUITY – MID CAP FUNDS

Motilal Oswal Midcap Fund

4

91.9

35735

1.6

0.8

-6.5

19.4

22.3

16.5

0.58

EQUITY – SECTOR – BANKING FUNDS

Nippon India Banking & Financial Services Fund

4

621.7

7470

2.0

1.2

1.3

13.9

14.3

14.3

0.44

EQUITY – MID CAP FUNDS

Nippon India Growth Mid Cap Fund

4

4393.3

45820

1.5

0.8

10.4

24.8

21.6

19.1

0.64

EQUITY – VALUE FUNDS

Nippon India Value Fund

4

221.0

8919

1.8

1.1

0.5

19.4

16.5

16.2

0.52

EQUITY – FLEXI CAP FUNDS

PGIM India Flexi Cap Fund

4

35.1

5793

1.9

0.6

0.6

10.4

9.6

14.0

0.28

EQUITY – LARGE & MID CAP FUNDS

Quant Large & Mid Cap Fund

4

120.7

3249

2.0

0.7

6.1

18.7

16.1

16.1

0.45

HYBRID – CONSERVATIVE HYBRID FUNDS

SBI Conservative Hybrid Fund

4

75.2

9754

1.5

1.1

4.5

9.0

8.9

8.8

0.83

EQUITY – LARGE & MID CAP FUNDS

SBI Large & Midcap Fund

4

631.4

38426

1.7

1.0

5.4

15.7

15.3

15.2

0.53

EQUITY – LARGE CAP FUNDS

SBI Large Cap Fund

4

91.3

53468

1.5

0.8

0.7

11.4

11.3

12.3

0.37

EQUITY – FLEXI CAP FUNDS

Union Flexi Cap Fund

4

49.4

2294

1.7

0.8

-0.2

12.8

12.2

13.2

0.37

HYBRID – AGGRESSIVE HYBRID FUNDS

UTI Aggressive Hybrid Fund

4

396.7

6524

1.9

1.2

-0.5

13.5

12.6

12.2

0.53

HYBRID – EQUITY SAVINGS FUNDS

UTI Equity Savings Fund

4

18.6

820

1.7

0.8

2.8

9.0

8.7

0.61

EQUITY – LARGE & MID CAP FUNDS

UTI Large & Mid Cap Fund

4

180.3

5896

1.9

1.0

3.6

19.7

16.2

14.5

0.55

EQUITY – SECTOR – BANKING FUNDS

Aditya Birla SL Bank & Fin Serv

3

60.2

3541

1.7

0.9

1.4

12.4

11.4

13.2

0.32

EQUITY – THEMATIC – CONSUMPTION FUNDS

Aditya Birla Sun Life Consumption Fund

3

198.7

5996

1.6

0.7

-5.4

10.9

11.6

13.9

0.35

EQUITY – FLEXI CAP FUNDS

Aditya Birla Sun Life Flexi Cap Fund

3

1838.2

25632

1.4

0.7

5.4

16.9

13.0

14.4

0.40

EQUITY – LARGE CAP FUNDS

Aditya Birla Sun Life Large Cap Fund

3

500.3

28970

1.4

0.8

-2.8

12.0

11.3

12.2

0.36

HYBRID – CONSERVATIVE HYBRID FUNDS

Aditya Birla Sun Life Regular Savings Fund

3

68.5

1479

1.5

0.8

3.5

8.2

7.9

8.4

0.67

HYBRID – BALANCED ADVANTAGE FUNDS

Axis Balanced Advantage Fund

3

20.9

3764

1.9

0.6

0.8

12.1

10.1

0.50

HYBRID – EQUITY SAVINGS FUNDS

Axis Equity Savings Fund

3

22.4

866

2.3

1.0

2.5

8.9

7.7

8.4

0.40

EQUITY – MID CAP FUNDS

Axis Midcap Fund

3

116.2

32276

1.6

0.5

7.1

18.6

15.3

17.1

0.45

HYBRID – AGGRESSIVE HYBRID FUNDS

Bandhan Aggressive Hybrid Fund

3

26.6

1919

1.8

0.5

7.1

14.4

12.3

0.44

EQUITY – FLEXI CAP FUNDS

Bandhan Flexi Cap Fund

3

203.9

7285

1.5

0.9

0.7

14.0

11.7

11.1

0.37

EQUITY – LARGE CAP FUNDS

Bandhan Large Cap Fund

3

75.2

2007

1.8

0.8

1.1

13.6

12.0

12.9

0.37

EQUITY – LARGE & MID CAP FUNDS

BOI Large & Mid Cap Equity Fund

3

90.3

468

2.1

1.0

6.2

16.3

14.0

13.1

0.42

EQUITY – TAX SAVING (ELSS) FUNDS

Baroda BNP Paribas ELSS Tax Saver Fund

3

95.4

887

2.0

0.9

3.6

16.9

12.6

12.8

0.38

EQUITY – LARGE CAP FUNDS

Baroda BNP Paribas Large Cap Fund

3

215.7

2579

1.7

0.7

-0.2

13.6

12.1

12.8

0.39

EQUITY – MID CAP FUNDS

Baroda BNP Paribas Mid Cap Fund

3

109.0

2389

1.7

0.5

11.4

21.4

17.4

16.1

0.52

HYBRID – CONSERVATIVE HYBRID FUNDS

Canara Robeco Conservative Hybrid Fund

3

96.6

864

1.5

0.6

0.2

6.8

6.3

7.8

0.42

HYBRID – AGGRESSIVE HYBRID FUNDS

Canara Robeco Equity Hybrid Fund

3

356.5

11024

1.5

0.5

1.2

11.7

10.4

12.5

0.39

EQUITY – FLEXI CAP FUNDS

Canara Robeco Flexi Cap Fund

3

330.4

13083

1.5

0.5

0.5

12.8

11.5

14.4

0.36

EQUITY – LARGE & MID CAP FUNDS

Canara Robeco Large and Mid Cap Fund

3

244.2

24675

1.4

0.5

-2.5

13.9

12.5

15.2

0.39

HYBRID – AGGRESSIVE HYBRID FUNDS

DSP Aggressive Hybrid Fund

3

342.4

11582

1.5

0.6

-3.7

12.4

10.2

12.2

0.37

HYBRID – BALANCED ADVANTAGE FUNDS

DSP Dynamic Asset Allocation Fund

3

28.0

3661

1.6

0.6

2.9

10.7

8.2

8.9

0.44

HYBRID – EQUITY SAVINGS FUNDS

DSP Equity Savings Fund

3

22.1

3541

1.3

0.6

1.9

9.0

7.8

8.1

0.60

EQUITY – FLEXI CAP FUNDS

DSP Flexi Cap Fund

3

98.8

11769

1.5

0.6

-2.2

13.8

11.3

14.4

0.33

EQUITY – LARGE & MID CAP FUNDS

DSP Large & Mid Cap Fund

3

603.7

17331

1.4

0.5

-0.6

17.6

13.7

15.3

0.45

HYBRID – CONSERVATIVE HYBRID FUNDS

DSP Regular Savings Fund

3

59.8

179

1.0

0.5

2.3

8.9

7.3

7.2

0.57

EQUITY – SMALL CAP FUNDS

DSP Small Cap Fund

3

204.2

17906

1.4

0.6

9.4

19.6

18.2

16.7

0.50

EQUITY – LARGE & MID CAP FUNDS

Edelweiss Large & Mid Cap Fund

3

87.1

4531

1.9

0.5

3.9

16.6

14.2

14.9

0.45

EQUITY – LARGE CAP FUNDS

Edelweiss Large Cap Fund

3

80.6

1439

2.1

0.7

-2.1

11.5

11.2

12.7

0.35

HYBRID – AGGRESSIVE HYBRID FUNDS

Franklin India Aggressive Hybrid Fund

3

259.9

2306

1.7

0.8

-2.7

12.0

10.4

11.0

0.40

HYBRID – CONSERVATIVE HYBRID FUNDS

Franklin India Conservative Hybrid Fund

3

90.6

188

1.2

0.6

0.5

7.9

6.7

7.1

0.46

EQUITY – TAX SAVING (ELSS) FUNDS

Franklin India ELSS Tax Saver Fund

3

1376.7

6106

1.6

0.9

-5.5

14.4

13.3

12.6

0.42

EQUITY – LARGE CAP FUNDS

Franklin India Large Cap Fund

3

974.3

7236

1.5

1.0

-3.0

11.5

9.0

10.8

0.29

EQUITY – SECTOR – IT FUNDS

Franklin India Technology Fund

3

448.7

1648

1.8

1.0

-9.6

14.0

10.2

14.6

0.24

HYBRID – AGGRESSIVE HYBRID FUNDS

HDFC Hybrid Equity Fund

3

110.2

22297

1.6

1.0

-6.1

7.4

9.3

11.2

0.36

EQUITY – SMALL CAP FUNDS

HDFC Small Cap Fund

3

133.3

38168

1.5

0.7

0.2

15.1

17.5

17.7

0.49

EQUITY – VALUE FUNDS

HDFC Value Fund

3

741.5

7324

1.8

1.0

3.3

17.5

15.1

14.3

0.48

HYBRID – BALANCED ADVANTAGE FUNDS

HSBC Balanced Advantage Fund

3

42.7

1506

2.1

0.8

0.5

9.5

7.9

8.3

0.35

HYBRID – CONSERVATIVE HYBRID FUNDS

HSBC Conservative Hybrid Fund

3

62.1

146

2.1

1.2

1.9

8.7

7.3

7.5

0.43

HYBRID – EQUITY SAVINGS FUNDS

HSBC Equity Savings Fund

3

35.7

905

5.5

4.7

10.9

13.2

11.1

9.4

0.52

EQUITY – FLEXI CAP FUNDS

HSBC Flexi Cap Fund

3

222.0

5405

2.3

1.5

5.5

18.2

14.7

13.4

0.41

EQUITY – SECTOR – BANKING FUNDS

ICICI Prudential Banking & Financial Services

3

127.2

10589

2.2

1.4

-3.0

10.8

10.2

13.7

0.32

EQUITY – TAX SAVING (ELSS) FUNDS

ICICI Pru Long Term Equity

3

898.5

13911

1.7

1.1

-1.0

13.7

12.4

13.1

0.41

EQUITY – MID CAP FUNDS

ICICI Prudential Midcap Fund

3

337.7

7557

1.8

1.0

19.9

26.7

20.0

17.8

0.60

EQUITY – SMALL CAP FUNDS

ICICI Prudential Smallcap Fund

3

85.6

8741

1.8

0.8

1.6

14.6

16.5

16.3

0.54

HYBRID – BALANCED ADVANTAGE FUNDS

Invesco India Balanced Advantage Fund

3

51.4

1024

1.8

0.7

-2.3

9.6

8.2

9.5

0.31

EQUITY – LARGE & MID CAP FUNDS

Invesco India Large & Mid Cap Fund

3

99.9

9761

1.5

0.5

6.6

22.7

17.2

16.2

0.48

EQUITY – LARGE CAP FUNDS

Invesco India Largecap Fund

3

67.7

1722

1.8

0.7

0.2

14.6

12.6

12.8

0.39

EQUITY – VALUE FUNDS

JM Value Fund

3

90.5

826

3.0

1.8

-5.9

16.5

15.6

16.1

0.46

HYBRID – BALANCED ADVANTAGE FUNDS

Kotak Balanced Advantage Fund

3

20.4

17184

1.7

0.6

0.7

9.6

8.8

0.40

EQUITY – TAX SAVING (ELSS) FUNDS

Kotak ELSS Tax Saver Fund

3

110.6

6112

1.8

0.7

-2.0

12.5

12.5

14.3

0.38

EQUITY – FLEXI CAP FUNDS

Kotak Flexicap Fund

3

83.1

54839

1.4

0.6

0.4

14.1

12.3

14.0

0.38

EQUITY – LARGE & MID CAP FUNDS

Kotak Large & Midcap Fund

3

337.5

30251

1.6

0.6

2.5

16.3

14.8

15.6

0.46

EQUITY – MID CAP FUNDS

Kotak Midcap Fund

3

139.2

63539

1.4

0.4

9.5

21.2

18.2

17.9

0.54

EQUITY – SMALL CAP FUNDS

Kotak Small Cap Fund

3

255.2

17416

1.7

0.6

1.5

14.3

14.5

16.9

0.40

EQUITY – DIVIDEND YIELD FUNDS

LIC MF Dividend Yield Fund

3

31.0

661

2.5

1.1

2.8

20.5

16.0

0.47

EQUITY – TAX SAVING (ELSS) FUNDS

Mahindra Manulife ELSS Tax Saver Fund

3

26.7

889

2.0

0.6

-4.6

10.5

11.2

0.35

HYBRID – EQUITY SAVINGS FUNDS

Mahi Manu Eq Sav Dhan San Yojana

3

21.0

531

2.1

0.7

3.7

9.4

8.1

0.43

HYBRID – AGGRESSIVE HYBRID FUNDS

Mirae Asset Aggressive Hybrid Fund

3

32.4

9363

1.5

0.4

3.3

12.2

10.7

12.6

0.41

EQUITY – THEMATIC – CONSUMPTION FUNDS

Mirae Asset Great Consumer Fund

3

87.2

4455

1.6

0.4

-2.1

12.1

13.3

15.4

0.38

EQUITY – SECTOR – PHARMA FUNDS

Mirae Asset Healthcare Fund

3

42.3

2939

1.7

0.5

14.9

26.9

14.7

0.47

EQUITY – LARGE & MID CAP FUNDS

Mirae Asset Large & Midcap Fund

3

151.6

42338

1.3

0.5

5.2

15.9

12.7

17.1

0.38

EQUITY – LARGE CAP FUNDS

Mirae Asset Large Cap Fund

3

108.1

38239

1.3

0.5

-1.5

10.3

9.8

13.1

0.30

EQUITY – TAX SAVING (ELSS) FUNDS

Motilal Oswal ELSS Tax Saver Fund

3

52.8

4659

2.0

0.8

4.3

22.6

18.2

17.0

0.46

HYBRID – BALANCED ADVANTAGE FUNDS

Nippon India Balanced Advantage Fund

3

177.4

9620

2.0

0.9

1.9

11.1

9.5

11.2

0.49

EQUITY – SECTOR – PHARMA FUNDS

Nippon India Pharma Fund

3

540.9

8365

2.3

1.5

8.3

24.5

13.2

15.2

0.43

EQUITY – LARGE & MID CAP FUNDS

Nippon India Vision Large & Mid Cap Fund

3

1458.7

7081

1.8

1.1

2.5

18.8

15.9

13.7

0.50

EQUITY – MID CAP FUNDS

PGIM India Midcap Fund

3

63.5

10738

2.0

0.8

2.6

13.0

13.2

15.9

0.39

EQUITY – TAX SAVING (ELSS) FUNDS

Quantum ELSS Tax Saver Fund

3

116.4

209

2.1

0.9

-5.0

13.1

11.0

11.6

0.39

EQUITY – SECTOR – BANKING FUNDS

SBI Banking & Financial Services Fund

3

42.5

10375

2.0

1.1

4.5

16.7

12.7

15.9

0.36

EQUITY – THEMATIC – CONSUMPTION FUNDS

SBI Consumption Opportunities Fund

3

280.8

2933

2.5

1.5

-8.1

9.4

13.6

14.1

0.43

HYBRID – AGGRESSIVE HYBRID FUNDS

SBI Equity Hybrid Fund

3

306.9

83353

1.3

0.7

4.3

13.8

11.3

12.4

0.48

HYBRID – EQUITY SAVINGS FUNDS

SBI Equity Savings Fund

3

24.3

5700

2.6

2.0

3.2

10.0

8.6

8.7

0.52

EQUITY – FLEXI CAP FUNDS

SBI Flexicap Fund

3

105.1

22403

2.3

1.5

-0.3

10.0

9.8

12.2

0.31

EQUITY – SECTOR – PHARMA FUNDS

SBI Healthcare Opportunities Fund

3

466.3

4323

1.9

0.9

11.3

26.7

15.8

13.2

0.54

EQUITY – MID CAP FUNDS

SBI Midcap Fund

3

234.8

23247

1.6

0.9

1.3

14.6

15.8

14.3

0.49

HYBRID – AGGRESSIVE HYBRID FUNDS

Sundaram Aggressive Hybrid Fund

3

155.5

8484

1.7

0.7

-2.2

10.6

9.9

12.1

0.37

EQUITY – TAX SAVING (ELSS) FUNDS

Sundaram ELSS Tax Saver Fund

3

483.4

1296

2.2

1.6

-2.1

11.9

11.9

13.7

0.39

EQUITY – MID CAP FUNDS

Sundaram Mid Cap Fund

3

1431.6

13378

1.7

0.9

8.1

23.5

19.3

15.3

0.57

EQUITY – SMALL CAP FUNDS

Sundaram Small Cap Fund

3

276.2

3563

1.9

0.9

10.9

20.2

18.1

15.1

0.48

HYBRID – AGGRESSIVE HYBRID FUNDS

Tata Aggressive Hybrid Fund

3

424.6

3865

1.9

1.0

-0.6

9.0

9.8

9.8

0.36

EQUITY – SECTOR – BANKING FUNDS

Tata Banking and Financial Services Fund

3

42.2

3043

1.9

0.6

1.0

13.2

11.7

14.8

0.33

EQUITY – TAX SAVING (ELSS) FUNDS

Tata ELSS Fund

3

44.9

4519

1.8

0.8

3.7

14.9

13.3

14.1

0.42

EQUITY – FLEXI CAP FUNDS

Tata Flexi Cap Fund

3

23.4

3633

1.9

0.6

-1.3

13.7

11.1

0.35

EQUITY – THEMATIC – CONSUMPTION FUNDS

Tata India Consumer Fund

3

44.0

2591

2.0

0.8

3.4

16.0

14.8

16.2

0.42

EQUITY – LARGE CAP FUNDS

Tata Large Cap Fund

3

494.4

2688

2.0

1.0

0.4

12.4

11.6

12.2

0.37

EQUITY – MID CAP FUNDS

Tata Mid Cap Fund

3

445.6

5604

1.9

0.7

8.4

19.8

16.8

16.5

0.51

EQUITY – SMALL CAP FUNDS

Tata Small Cap Fund

3

35.0

11330

1.7

0.4

-9.3

11.6

15.3

0.43

EQUITY – VALUE FUNDS

Templeton India Value Fund

3

687.2

2150

1.7

0.8

-2.2

13.5

15.6

14.3

0.54

HYBRID – BALANCED ADVANTAGE FUNDS

Union Balanced Advantage Fund

3

19.8

1241

1.9

0.9

0.1

8.0

7.0

0.27

EQUITY – TAX SAVING (ELSS) FUNDS

Union ELSS Tax Saver Fund

3

62.7

841

2.0

1.2

0.4

12.6

12.8

12.8

0.39

EQUITY – SMALL CAP FUNDS

Union Small Cap Fund

3

53.6

1980

1.8

0.8

17.9

20.4

18.2

16.4

0.46

EQUITY – VALUE FUNDS

Union Value Fund

3

27.7

373

2.1

1.1

1.8

16.2

14.5

0.48

HYBRID – CONSERVATIVE HYBRID FUNDS

UTI Conservative Hybrid Fund

3

69.0

1652

2.0

1.4

-0.3

7.8

8.0

7.7

0.60

EQUITY – DIVIDEND YIELD FUNDS

UTI Dividend Yield Fund

3

173.3

3750

2.4

1.9

1.1

17.2

14.1

14.5

0.48

EQUITY – LARGE CAP FUNDS

UTI Large Cap Fund

3

257.2

12053

1.9

1.2

-4.2

9.6

9.0

11.7

0.26

EQUITY – VALUE FUNDS

UTI Value Fund

3

160.6

9433

2.1

1.5

-1.4

15.6

13.1

13.8

0.43

EQUITY – SECTOR – IT FUNDS

Aditya Birla Sun Life Digital India Fund

2

144.6

3799

1.6

0.8

-12.8

6.1

7.4

14.9

0.18

EQUITY – DIVIDEND YIELD FUNDS

Aditya Birla Sun Life Dividend Yield Fund

2

452.8

1475

1.8

1.1

4.4

17.1

16.0

13.6

0.53

HYBRID – AGGRESSIVE HYBRID FUNDS

Aditya Birla Sun Life Equity Hybrid ’95 Fund

2

1480.9

6999

1.5

0.9

-0.7

11.3

9.4

10.1

0.31

HYBRID – EQUITY SAVINGS FUNDS

Aditya Birla Sun Life Equity Savings Fund

2

22.8

1087

0.9

0.5

5.3

8.6

7.0

8.0

0.34

EQUITY – MID CAP FUNDS

Aditya Birla Sun Life Midcap Fund

2

804.0

6290

1.6

0.9

6.1

19.3

16.8

14.1

0.49

EQUITY – VALUE FUNDS

Aditya Birla Sun Life Value Fund

2

130.6

6388

1.6

0.9

8.1

19.0

15.0

13.0

0.40

HYBRID – CONSERVATIVE HYBRID FUNDS

Axis Conservative Hybrid Fund

2

29.9

218

2.2

1.1

-0.2

5.9

5.5

6.5

0.28

EQUITY – FLEXI CAP FUNDS

Axis Flexi Cap Fund

2

26.0

12546

1.7

0.6

0.5

13.1

10.0

0.27

HYBRID – BALANCED ADVANTAGE FUNDS

Bandhan Balanced Advantage Fund

2

24.5

2209

1.7

0.6

3.0

9.6

8.0

8.7

0.31

HYBRID – BALANCED ADVANTAGE FUNDS

Bank of India Balanced Advantage Fund

2

25.7

153

2.1

1.1

5.3

10.2

10.2

7.3

0.43

EQUITY – SECTOR – BANKING FUNDS

Baroda BNP Paribas Bank&Fin Serv

2

46.7

389

2.1

0.7

-0.2

13.4

11.1

12.3

0.30

HYBRID – CONSERVATIVE HYBRID FUNDS

Baroda BNP Paribas Conser Hybrid

2

45.5

811

1.8

0.5

2.1

7.5

6.3

7.1

0.40

EQUITY – LARGE CAP FUNDS

DSP Large Cap Fund

2

451.3

7192

1.5

0.7

-3.6

14.1

11.3

11.8

0.38

EQUITY – TAX SAVING (ELSS) FUNDS

Edelweiss Long Term Equity

2

111.6

437

2.4

0.8

4.9

14.8

12.8

12.7

0.40

HYBRID – EQUITY SAVINGS FUNDS

Franklin India Equity Savings Fund

2

16.7

633

1.0

0.3

3.1

7.6

7.2

0.47

EQUITY – LARGE & MID CAP FUNDS

Franklin India Large & Mid Cap Fund

2

182.9

3399

1.7

1.1

-0.3

14.3

11.8

11.7

0.38

EQUITY – MID CAP FUNDS

Franklin India Mid Cap Fund

2

2682.0

12102

1.5

0.9

0.2

19.4

15.4

14.7

0.45

EQUITY – SMALL CAP FUNDS

Franklin India Small Cap Fund

2

168.7

13850

1.5

0.8

-0.1

17.3

18.5

15.3

0.50

HYBRID – AGGRESSIVE HYBRID FUNDS

HSBC Aggressive Hybrid Fund

2

56.3

5424

1.9

0.8

6.6

13.9

10.9

11.3

0.33

EQUITY – TAX SAVING (ELSS) FUNDS

HSBC ELSS Tax saver Fund

2

134.0

3939

2.1

1.3

3.1

17.3

13.9

13.8

0.39

EQUITY – LARGE CAP FUNDS

HSBC Large Cap Fund

2

456.0

1784

2.1

1.2

-0.6

11.7

10.4

12.2

0.31

EQUITY – SMALL CAP FUNDS

HSBC Small Cap Fund

2

81.6

16394

1.8

0.7

4.5

16.6

19.0

18.6

0.47

HYBRID – EQUITY SAVINGS FUNDS

ICICI Prudential Equity Savings Fund

2

23.0

16868

1.6

1.1

3.2

7.5

7.3

8.0

0.87

HYBRID – AGGRESSIVE HYBRID FUNDS

Invesco India Aggressive Hybrid Fund

2

20.8

762

2.0

0.7

-6.4

11.7

9.9

0.32

EQUITY – TAX SAVING (ELSS) FUNDS

Invesco India ELSS Tax Saver Fund

2

116.8

2542

1.7

0.8

-4.8

13.3

10.4

13.1

0.29

EQUITY – LARGE & MID CAP FUNDS

LIC MF Large & Midcap Fund

2

37.1

2958

3.5

2.3

-2.1

15.7

13.0

14.5

0.40

EQUITY – LARGE CAP FUNDS

LIC MF Large Cap Fund

2

51.7

1352

3.6

2.4

-6.4

8.6

8.2

10.4

0.23

EQUITY – FLEXI CAP FUNDS

Motilal Oswal Flexi Cap Fund

2

55.9

12770

1.9

1.1

-5.9

18.2

11.8

12.5

0.32

HYBRID – AGGRESSIVE HYBRID FUNDS

Navi Aggressive Hybrid Fund

2

20.7

111

2.1

0.5

4.4

11.4

10.5

0.39

EQUITY – FLEXI CAP FUNDS

Navi Flexi Cap Fund

2

23.5

260

2.1

0.5

6.7

12.2

11.5

0.35

HYBRID – AGGRESSIVE HYBRID FUNDS

Nippon India Aggressive Hybrid Fund

2

103.8

3958

2.1

1.3

1.4

12.8

12.0

10.0

0.47

EQUITY – TAX SAVING (ELSS) FUNDS

Nippon India ELSS Tax Saver Fund

2

129.3

14742

1.9

1.2

3.2

16.8

14.6

11.7

0.46

EQUITY – TAX SAVING (ELSS) FUNDS

PGIM India ELSS Tax Saver Fund

2

32.6

700

2.4

0.9

-4.5

8.8

10.2

12.8

0.32

EQUITY – SMALL CAP FUNDS

SBI Small Cap Fund

2

166.7

37141

1.6

0.9

0.2

12.6

13.9

17.8

0.42

HYBRID – BALANCED ADVANTAGE FUNDS

Sundaram Balanced Advantage Fund

2

34.3

1658

2.1

0.7

-1.3

8.8

7.7

7.5

0.32

EQUITY – THEMATIC – CONSUMPTION FUNDS

Sundaram Consumption Fund

2

88.1

1428

2.1

1.3

-7.4

11.7

11.8

11.9

0.36

EQUITY – LARGE & MID CAP FUNDS

Sundaram Large and Mid Cap Fund

2

84.5

6575

1.8

0.8

2.9

14.5

13.7

14.5

0.40

EQUITY – SECTOR – PHARMA FUNDS

Tata India Pharma & Healthcare Fund

2

31.6

1325

2.2

0.7

7.0

24.3

13.8

13.0

0.44

EQUITY – LARGE & MID CAP FUNDS

Tata Large & Mid Cap Fund

2

479.2

7802

1.8

0.7

-6.2

9.2

10.9

12.7

0.34

EQUITY – VALUE FUNDS

Tata Value Fund

2

339.3

8592

1.8

0.8

0.4

15.5

14.9

15.0

0.48

EQUITY – MID CAP FUNDS

Taurus Mid Cap Fund

2

116.8

123

2.1

1.7

-1.2

13.8

12.4

15.0

0.34

HYBRID – EQUITY SAVINGS FUNDS

Union Equity Savings Fund

2

16.9

142

1.7

1.3

1.9

7.0

6.2

0.31

EQUITY – LARGE CAP FUNDS

Union Largecap Fund

2

22.6

439

2.1

1.3

-1.7

10.1

9.9

0.30

EQUITY – SECTOR – BANKING FUNDS

UTI Banking and Financial Services Fund

2

186.6

1350

4.4

3.4

1.0

12.7

11.4

11.6

0.32

EQUITY – TAX SAVING (ELSS) FUNDS

UTI ELSS Tax Saver Fund

2

195.0

3438

2.1

1.2

-3.5

11.0

9.8

12.1

0.28

EQUITY – FLEXI CAP FUNDS

UTI Flexi Cap Fund

2

296.5

22168

1.6

1.0

-6.1

8.1

6.4

11.6

0.14

EQUITY – THEMATIC – CONSUMPTION FUNDS

UTI India Consumer Fund

2

54.4

674

2.5

1.7

-2.1

11.4

11.0

11.3

0.30

EQUITY – MID CAP FUNDS

UTI Mid Cap Fund

2

301.1

11680

2.1

1.3

3.9

16.0

14.5

14.4

0.41

EQUITY – TAX SAVING (ELSS) FUNDS

Aditya Birla Sun Life ELSS Tax Saver Fund

1

59.5

14378

1.5

0.8

2.4

13.6

9.1

10.8

0.26

EQUITY – LARGE & MID CAP FUNDS

Aditya Birla Sun Life Large & Mid Cap Fund

1

901.6

5648

1.6

0.9

3.1

13.6

9.8

12.0

0.25

EQUITY – SMALL CAP FUNDS

Aditya Birla Sun Life Small Cap Fund

1

90.4

5253

1.6

0.8

9.7

17.7

14.2

13.4

0.37

HYBRID – AGGRESSIVE HYBRID FUNDS

Axis Aggressive Hybrid Fund

1

20.0

1451

2.3

1.2

-0.7

9.7

8.2

0.27

EQUITY – TAX SAVING (ELSS) FUNDS

Axis ELSS Tax Saver Fund

1

92.2

31566

1.9

1.2

-2.1

11.6

7.9

12.0

0.19

EQUITY – LARGE CAP FUNDS

Axis Large Cap Fund

1

57.1

30498

1.6

0.7

-3.7

9.4

7.3

11.9

0.19

HYBRID – CONSERVATIVE HYBRID FUNDS

Bandhan Conservative Hybrid Fund

1

32.1

98

1.7

0.8

0.0

6.2

5.2

6.4

0.24

HYBRID – EQUITY SAVINGS FUNDS

Bandhan Equity Savings Fund

1

31.9

389

0.9

0.2

3.1

6.9

6.4

6.3

0.52

EQUITY – MID CAP FUNDS

DSP Midcap Fund

1

149.9

19459

1.4

0.6

6.2

19.4

13.1

15.2

0.38

EQUITY – LARGE CAP FUNDS

Groww Largecap Fund

1

41.5

128

2.7

1.4

0.0

11.4

10.3

11.1

0.30

EQUITY – MID CAP FUNDS

HSBC Midcap Fund

1

438.0

13387

3.6

2.5

19.9

27.2

19.2

17.6

0.49

HYBRID – AGGRESSIVE HYBRID FUNDS

LIC MF Aggressive Hybrid Fund

1

193.3

509

2.4

1.3

0.4

11.3

9.2

9.7

0.31

EQUITY – SECTOR – BANKING FUNDS

LIC MF Banking & Financial Services Fund

1

20.5

262

2.4

1.2

1.0

8.1

9.6

9.9

0.27

EQUITY – TAX SAVING (ELSS) FUNDS

LIC MF ELSS Tax Saver

1

140.7

994

2.2

1.0

-6.1

10.8

10.6

12.0

0.33

EQUITY – FLEXI CAP FUNDS

LIC MF Flexi Cap Fund

1

96.7

973

3.5

2.4

5.2

11.8

10.6

10.6

0.29

EQUITY – MID CAP FUNDS

LIC MF Midcap Fund

1

29.2

347

2.4

1.3

2.8

19.3

14.6

0.39

EQUITY – SMALL CAP FUNDS

LIC MF Small Cap Fund

1

31.4

660

2.8

1.5

7.1

17.5

17.9

0.45

EQUITY – VALUE FUNDS

LIC MF Value Fund

1

26.0

208

3.1

1.8

12.0

16.6

13.6

0.37

EQUITY – THEMATIC – CONSUMPTION FUNDS

Mahindra Manulife Consumption Fund

1

21.0

504

2.1

0.6

-4.0

11.1

11.1

0.33

HYBRID – BALANCED ADVANTAGE FUNDS

Motilal Oswal Balanced Advantage Fund

1

18.0

734

2.4

1.1

-3.3

5.0

4.2

0.08

EQUITY – LARGE & MID CAP FUNDS

Navi Large & Midcap Fund

1

35.1

300

2.1

0.5

1.4

11.4

11.8

12.7

0.34

HYBRID – CONSERVATIVE HYBRID FUNDS

Nippon India Conservative Hybrid Fund

1

60.5

951

1.9

1.1

5.8

7.9

7.7

5.7

1.00

HYBRID – EQUITY SAVINGS FUNDS

Nippon India Equity Savings Fund

1

16.2

853

1.6

0.5

2.5

6.7

6.9

4.8

0.45

HYBRID – AGGRESSIVE HYBRID FUNDS

PGIM India Aggressive Hybrid Equity Fund

1

125.9

204

2.4

0.8

-1.3

8.8

7.6

8.8

0.23

EQUITY – LARGE CAP FUNDS

PGIM India Large Cap Fund

1

321.6

544

2.5

0.9

-3.3

8.2

7.6

10.3

0.22

EQUITY – VALUE FUNDS

Quantum Value Fund

1

117.2

1114

2.1

1.1

-5.2

13.3

11.0

11.5

0.39

EQUITY – FLEXI CAP FUNDS

Shriram Flexi Cap Fund

1

19.2

128

3.3

1.7

-1.6

9.1

8.4

0.21

EQUITY – DIVIDEND YIELD FUNDS

Sundaram Dividend Yield Fund

1

130.7

856

2.3

1.1

-1.8

13.3

12.1

14.9

0.42

EQUITY – SECTOR – IT FUNDS

Tata Digital India Fund

1

38.9

9697

1.7

0.6

-16.1

6.6

7.7

14.4

0.18

EQUITY – FLEXI CAP FUNDS

Taurus Flexi Cap Fund

1

219.1

344

2.1

2.0

-0.7

12.5

10.7

10.2

0.31

EQUITY – SECTOR – PHARMA FUNDS

UTI Healthcare Fund

1

308.8

1144

2.3

1.4

12.2

27.7

14.1

13.5

0.45

HYBRID – BALANCED ADVANTAGE FUNDS

UTI-Unit Linked Insurance Plan

1

40.8

4923

1.6

1.0

-2.3

7.0

6.5

7.3

0.27

HYBRID – CONSERVATIVE HYBRID FUNDS

Bank of India Conservative Hybrid Fund

34.7

65

1.9

1.0

2.2

6.7

9.8

7.2

0.84

EQUITY – MULTI CAP FUNDS

Baroda BNP Paribas Multi Cap Fund

285.8

3219

1.7

0.8

4.2

17.1

15.8

14.7

0.44

EQUITY – SMALL CAP FUNDS

Canara Robeco Small Cap Fund

38.3

13276

1.5

0.5

2.6

14.7

16.9

0.49

EQUITY – SMALL CAP FUNDS

Edelweiss Small Cap Fund

44.5

5952

2.1

0.8

6.0

18.4

17.8

0.52

HYBRID – AGGRESSIVE HYBRID FUNDS

Groww Aggressive Hybrid Fund

20.1

50

3.7

2.8

-0.8

9.4

8.8

0.28

EQUITY – TAX SAVING (ELSS) FUNDS

Groww ELSS Tax Saver Fund

18.5

50

2.8

1.3

-3.5

10.5

9.7

0.27

EQUITY – VALUE FUNDS

Groww Value Fund

26.4

67

2.8

1.3

0.5

14.9

12.6

10.5

0.39

EQUITY – LARGE & MID CAP FUNDS

HSBC Large & Mid Cap Fund

28.4

4877

3.1

2.0

11.9

20.1

15.8

0.40

EQUITY – THEMATIC – CONSUMPTION FUNDS

ICICI Prudential FMCG Fund

423.0

1676

2.5

1.7

-10.8

0.8

8.5

10.3

0.26

EQUITY – MULTI CAP FUNDS

ICICI Prudential Multicap Fund

832.3

16997

1.7

0.9

7.1

19.9

16.7

15.4

0.57

EQUITY – CONTRA FUNDS

Invesco India Contra Fund

128.5

19406

1.4

0.5

-1.9

16.8

13.9

15.6

0.43

HYBRID – EQUITY SAVINGS FUNDS

Invesco India Equity Savings Fund

16.3

330

2.1

0.8

-2.6

8.3

6.6

0.29

EQUITY – MULTI CAP FUNDS

Invesco India Multicap Fund

122.6

3995

1.6

0.6

-4.1

14.8

12.6

13.6

0.36

EQUITY – CONTRA FUNDS

Kotak Contra Fund

147.5

5154

1.9

0.6

2.2

17.7

15.4

16.1

0.49

HYBRID – CONSERVATIVE HYBRID FUNDS

LIC MF Conservative Hybrid Fund

82.0

47

2.1

1.2

0.3

5.3

5.2

6.1

0.25

HYBRID – EQUITY SAVINGS FUNDS

LIC MF Equity Savings Fund

28.1

34

2.3

1.3

2.5

9.2

7.3

6.8

0.35

EQUITY – SECTOR – PHARMA FUNDS

LIC MF Healthcare Fund

31.1

85

2.4

1.1

10.8

24.6

11.1

0.32

EQUITY – LARGE CAP FUNDS

Mahindra Manulife Large Cap Fund

21.6

701

2.0

0.6

-4.9

10.7

9.6

0.30

EQUITY – MULTI CAP FUNDS

Mahindra Manulife Multi Cap Fund

36.4

6439

1.6

0.4

7.3

19.5

16.7

0.48

EQUITY – MULTI CAP FUNDS

Nippon India Multi Cap Fund

296.6

52634

1.6

0.9

2.9

19.1

20.3

16.2

0.65

HYBRID – EQUITY SAVINGS FUNDS

PGIM India Equity Savings Fund

49.9

60

1.3

0.6

2.2

6.0

6.1

6.8

0.48

EQUITY – FLEXI CAP FUNDS

Quant Flexi Cap Fund

103.9

6594

2.0

0.8

8.3

18.5

17.1

19.5

0.48

EQUITY – MULTI CAP FUNDS

Quant Multi Cap Fund

631.5

7466

1.9

0.7

2.3

12.9

12.5

17.3

0.33

EQUITY – CONTRA FUNDS

SBI Contra Fund

371.6

47352

1.5

0.7

-1.1

15.7

17.6

16.1

0.66

HYBRID – AGGRESSIVE HYBRID FUNDS

Shriram Aggressive Hybrid Fund

31.2

49

2.4

0.7

1.4

10.3

8.4

9.5

0.27

EQUITY – TAX SAVING (ELSS) FUNDS

Shriram ELSS Tax Saver Fund

20.1

46

3.2

1.6

-1.3

8.6

8.4

0.21

HYBRID – CONSERVATIVE HYBRID FUNDS

Sundaram Conservative Hybrid Fund

29.0

19

1.9

1.1

-2.4

5.0

6.3

6.2

0.43

EQUITY – MULTI CAP FUNDS

Sundaram Multi Cap Fund

366.2

2807

2.0

0.9

-0.1

14.9

14.1

14.9

0.43

EQUITY – VALUE FUNDS

Sundaram Value Fund

207.0

1323

2.2

1.6

-3.2

9.5

10.6

11.2

0.35

HYBRID – BALANCED ADVANTAGE FUNDS

Tata Balanced Advantage Fund

20.5

9128

1.7

0.5

1.9

9.2

9.0

0.44

EQUITY – SECTOR – BANKING FUNDS

Taurus Banking & Financial Services Fund

51.9

11

2.1

1.4

-2.3

9.2

10.0

13.0

0.28

EQUITY – TAX SAVING (ELSS) FUNDS

Taurus ELSS Tax Saver Fund

175.2

71

2.1

1.5

-3.3

12.4

11.7

13.1

0.39

EQUITY – LARGE CAP FUNDS

Taurus Large Cap Fund

154.4

51

2.1

1.9

1.0

13.0

10.9

10.6

0.33


Source link

Buying What Markets Ignore

Buying What Markets Ignore


Motilal Oswal Mutual Fund has entered the contra fund category with an NFO in May, adding to a relatively under-populated segment that currently houses only three schemes: SBI Contra, Invesco India Contra and Kotak India EQ Contra Fund. The launch comes at a time when the category, though small, has quietly built a track record that merits closer scrutiny. The key question is whether these funds have consistently outperformed broader benchmarks over the long term, and how their stock-picking frameworks differ.

Contra funds invest in stocks or sectors that are currently out of favour and ignored by the market, betting on a turnaround in sentiment and business performance. In contrast, value funds focus on stocks trading below their intrinsic or fundamental value, irrespective of market popularity. While value investors may still buy popular companies if valuations are attractive, contra investors generally avoid crowded trades and prefer neglected opportunities linked to market inefficiencies.

The category’s limited size can be traced to SEBI’s 2017 classification norms, which required fund houses to offer either a value fund or a contra fund, but not both. Consequently, AMCs largely gravitated towards value strategies, leading to over 40 such schemes across active and passive categories. However, a regulatory shift in February 2026 now permits AMCs to operate both categories, subject to portfolio overlap remaining below 50 per cent.

Performance track record

Despite its small universe, the contra category has delivered competitive returns. Over the last 10 years, five-year rolling returns averaged about 19 per cent CAGR, outperforming the Nifty 50 TRI (15 per cent) and Nifty 500 TRI (17 per cent). Flexi-cap funds, often considered a comparable diversified category, delivered around 16 per cent.

Within the segment, SBI Contra has been the standout performer, generating 22 per cent CAGR on this measure, followed by Kotak Contra and Invesco India Contra at 18 per cent and 17 per cent, respectively. On a three-year rolling basis too, contra funds maintained an edge, delivering about 18 per cent compared with 15 per cent for the Nifty 500 TRI.

Divergent frameworks

Each fund house deploys a distinct framework to identify contrarian opportunities.

SBI Contra adopts a three-bucket approach: turnaround, cyclical and value. Turnaround ideas focus on companies facing temporary operational or financial stress but with identifiable triggers such as management change or restructuring. The cyclical bucket tracks sectors nearing the bottom of their cycles, using indicators such as capacity utilisation and pricing power. The value segment targets overlooked businesses trading at significant discounts to long-term potential.

Kotak Contra builds a contrarian universe from its research coverage of over 550 stocks. Eligibility is based on five predefined filters: underperformance versus the NSE 500 index, trading below long-term average valuations, lower valuation multiples relative to sector peers, sectoral underperformance versus the benchmark, or trading below the 200-day moving average. From this universe, the fund applies its BMV framework (business, management and valuation) to identify fundamentally-strong companies with re-rating potential. The final portfolio usually consists of 50-60 stocks.

Invesco India Contra focuses on four categories of opportunities: companies in a turnaround phase, stocks trading below fundamental value, businesses benefiting from cyclical upturns and growth companies available at attractive valuations. It actively takes overweight and underweight sector calls against the benchmark based on valuation opportunities and sector rotation trends. The portfolio is mandated to maintain about 50-60 per cent exposure to value-oriented ideas.

The new Motilal Oswal Contra Fund plans to follow a “contra growth” strategy, differentiating itself from existing contra schemes that largely adopt a value-oriented approach while identifying contrarian opportunities. The fund aims to identify opportunities arising from sectoral dislocations, low investor interest, weak analyst coverage and valuation gaps relative to sector averages. The strategy categorises ideas into short-, medium- and long-term opportunities. It will primarily use the PEG (price/earnings-to-growth) framework targeting a portfolio PEG ratio of around 1.2 and focusing on companies with strong profit-growth visibility over the next two-three years. Key quality filters include operating cash flow-to-net worth, strong profit-to-cash-flow conversion and return ratios. The portfolio will remain concentrated with 25-30 high-conviction stocks and is unlikely to exceed 35 holdings.

Current opportunities

Across funds, current positioning reflects a mix of cyclical and structural calls.

SBI Contra has identified oil and gas as a contrarian opportunity, citing temporary earnings pressure linked to geopolitical developments. It also sees selective turnaround opportunities in pharma, while remaining cautious on IT from a sectoral perspective. Over the last three months, the fund has newly added UPL and significantly increased exposure to E.I.D. Parry (India), ICICI Bank and Prism Johnson.

Kotak Contra remains overweight on financials, citing valuations are below long-term averages even as credit growth and asset-quality trends improve. Healthcare is another preferred segment, particularly domestic pharma and hospital chains. Recent additions to the portfolio include Tata Steel, Indus Towers and Coal India.

Meanwhile, the fund manager of Motilal Oswal Contra sees short-term contrarian opportunities in auto, tyres and chemicals, where profitability has been temporarily impacted by elevated crude oil prices. The fund expects earnings recovery in these sectors once crude prices normalise over the coming quarters. Medium-term opportunities are being identified in banks, NBFCs and pharma. In financials, the fund expects greater clarity on asset quality and provisioning under the RBI’s expected credit loss (ECL) norms over the next two quarters, which could help differentiate stronger lenders from weaker peers. For long-term contrarian opportunities, the fund manager identified IT as a key structural play. While near-term disruption and revenue pressure may persist, the fund believes quality IT companies could emerge stronger over the next two-three years.

Investment takeaways

Contra investing is inherently timing-sensitive. Even well-founded ideas may remain out of favour for extended periods, leading to interim underperformance and testing investor patience. Another major risk is “value traps”, where beaten-down stocks fail to recover due to structural issues. Further, contra funds can lag during momentum-driven bull markets, as their portfolios are skewed towards under-owned or temporarily weak segments.

Not every stock in a contra fund portfolio necessarily represents a contrarian opportunity, as several holdings overlap with other diversified equity funds. While the initial stock selection is driven by contrarian ideas, portfolio exits are managed similarly to other actively-managed funds, based on factors such as weakening growth outlook, stretched valuations or deterioration in business fundamentals.

By targeting out-of-favour stocks, the contrarian approach takes time to deliver. Contra funds suit patient, risk-tolerant investors with an investment horizon of more than five years. They are suited as a satellite allocation within a diversified portfolio. All the three funds in the category managed to deliver better returns over long run. they could meaningfully enhance portfolio diversification and long-term return potential despite the occasional risk of value traps.

Published on May 16, 2026


Source link

MFs Cut Their Cash Cushion

MFs Cut Their Cash Cushion


Active equity mutual funds have sharply cut their cash buffers over the past year. Cash holdings fell from ₹3 lakh crore in April 2025 to ₹1.68 lakh crore in April 2026, while cash as a share of active equity fund AUM declined from 6.8 per cent to 4.7 per cent. This matters because cash levels offer a useful, though sometimes imperfect, signal of fund managers’ risk appetite, valuation comfort and market positioning.

bl.portfolio analysed the cash holdings of 577 actively-managed equity-oriented schemes, including diversified, sectoral and thematic funds, between April 2025 and April 2026. This was done to understand how managers positioned portfolios amid volatile market conditions, including the US tariff shock, West Asia conflict-related risk and uneven market performance across large-, mid- and small-cap segments.

Sustained retail flows have provided steady liquidity, with SIP (systematic investment plan) inflows averaging nearly ₹29,500 crore a month over the last one year.

For market context, in the one-year period ended May 15, 2026, the Nifty 50 TRI (includes dividends) declined 4.5 per cent. In contrast, the Nifty Midcap 150 TRI gained 8 per cent, the Nifty Smallcap 250 TRI rose 4 per cent and the Nifty Microcap 250 TRI advanced 2 per cent.

Buffers shrink

The nearly 2 percentage point decline in cash as a share of active equity fund AUM marks a clear reversal from April 2025, when cash levels were at a six-year high.

Elevated cash holdings usually coincide with market uncertainty, rich valuations or heavy inflows awaiting deployment. The April 2025 spike likely reflected caution after a strong market run and valuation concerns.

The subsequent fall in both absolute cash and cash as a share of AUM suggests that funds deployed part of their liquidity buffers. This could be either due to improving conviction or the need to reduce cash drag, where uninvested money hurts returns when markets rise.

Category-wise shift

Among diversified equity categories, mid-cap, small-cap, flexi-cap and value funds saw significant reductions in cash holdings over the year.

Mid-cap funds reduced cash holdings by over 3.5 percentage points, while flexi-cap and small-cap funds cut cash by over 2.6 percentage points and 2.3 percentage points, respectively.

Contra funds also saw a steep fall of more than 4.6 percentage points, showing that even strategies built around selective, out-of-favour opportunities reduced liquidity buffers.

However, some sectoral categories moved in the opposite direction. Technology and pharma & healthcare funds increased cash buffers, with technology funds alone seeing a rise of over 3.5 percentage points. This divergence suggests greater caution in sectors exposed to global demand, currency movements, regulatory risks or valuation uncertainty.

Within thematic funds, several sub-categories saw notable reductions in cash allocations. Funds focused on rural opportunities and housing reduced cash meaningfully. In contrast, themes such as commodities and manufacturing saw a marginal increase in cash, suggesting some caution in more cyclical pockets.

Biggies cut cash

The trend was visible even among schemes with assets exceeding ₹50,000 crore.

Nine of the 11 large schemes saw cash levels decline over the past year. Parag Parikh Flexi Cap reduced cash holdings from nearly 24 per cent to 15 per cent, while HDFC Flexi Cap cut its allocation by over 5.6 percentage points. Large-cap funds from ICICI Prudential and SBI also reduced liquidity positions significantly.

For large schemes, cash management is also shaped by liquidity considerations, as deploying or exiting large positions can be harder, especially outside the most liquid large-cap names. Therefore, lower cash levels may signal greater willingness to participate in the market, but also the pressure on funds to avoid prolonged cash drag when peers may be deploying capital.

Who still holds cash

Despite the overall decline, some schemes continued to hold elevated cash positions, suggesting differentiated strategies rather than an uniform industry stance.

Value-oriented schemes such as DSP Value held over 18 per cent cash, while contra strategies such as SBI Contra Fund maintained allocations above 15 per cent.

Flexi-cap funds such as Parag Parikh also retained relatively high cash levels even after reducing cash year on year.

Such elevated cash holdings need not reflect caution alone. In value and contra strategies, cash may reflect valuation discipline, while in fast-growing schemes it may also represent recent inflows awaiting deployment.

Sharpest cash cuts

Among schemes that sharply reduced cash levels over the year, Motilal Oswal Midcap cut its cash allocation from over 32 per cent to just 4 per cent, a reduction of more than 28 percentage points.

Motilal Oswal Multi Cap and Sundaram Business Cycle also reduced cash by over 16 percentage points each. Such sharp changes should be read fund by fund.

The broader point is that many active managers appear to have cut cash drag, especially as mid- and small-cap segments delivered positive returns despite large-cap weakness.

Takeaways

For investors, lower cash is a two-sided signal. It helps funds participate better when markets recover, but leaves them with less ready money to buy stocks during corrections.

Cash levels should not be read mechanically. High cash may reflect valuation discipline, recent inflows or liquidity management. Low cash may reflect conviction, cash-drag concerns or the need to stay close to benchmarks.

Unutilised cash is not idle. It is usually parked in TREPS (Tri-Party Repo Dealing System) and other short-term instruments, so that funds still earn some return while waiting to invest. TREPS annualised yields have ranged between 3.1 per cent and 7 per cent over the last five years.

Cash levels are therefore useful, but not decisive. They must be read with the fund’s mandate, valuation style, flows, market-cap exposure and long-term performance.

Published on May 16, 2026


Source link

Mutual Funds returns

Mutual Funds returns


EQUITY – LARGE & MID CAP FUNDS

Bandhan Large & Mid Cap Fund

5

137.6

16672

1.4

0.4

6.7

22.3

19.0

16.2

0.59

HYBRID – BALANCED ADVANTAGE FUNDS

Baroda BNPP Balanced Advantage Fund

5

25.1

4756

1.6

0.6

5.6

13.1

11.7

0.44

HYBRID – AGGRESSIVE HYBRID FUNDS

BOI AXA Mid & Small Cap Eq&Debt

5

40.3

1482

1.8

0.7

8.3

19.9

17.3

0.49

EQUITY – LARGE CAP FUNDS

Canara Robeco Large Cap Fund

5

59.4

16542

1.4

0.5

-5.3

11.3

11.1

13.5

0.35

EQUITY – TAX SAVING (ELSS) FUNDS

DSP ELSS Tax Saver Fund

5

134.4

16337

1.7

0.7

-2.7

16.4

14.7

15.4

0.47

HYBRID – EQUITY SAVINGS FUNDS

Edelweiss Equity Savings Fund

5

26.4

1313

2.1

1.2

6.7

10.9

9.4

9.2

0.72

EQUITY – MID CAP FUNDS

Edelweiss Mid Cap Fund

5

104.4

15911

1.8

0.6

8.0

24.3

21.0

18.7

0.59

HYBRID – BALANCED ADVANTAGE FUNDS

HDFC Balanced Advantage Fund

5

506.9

105378

1.4

0.8

-1.1

14.5

15.8

14.7

0.77

EQUITY – FLEXI CAP FUNDS

HDFC Flexi Cap Fund

5

1936.1

100479

1.4

0.7

-1.1

17.8

18.5

16.3

0.68

EQUITY – LARGE & MID CAP FUNDS

HDFC Large and Mid Cap Fund

5

330.1

28255

1.6

0.9

0.0

16.8

17.1

14.9

0.54

EQUITY – MID CAP FUNDS

HDFC Mid Cap Fund

5

197.3

94745

1.4

0.8

6.6

22.8

21.2

17.9

0.67

EQUITY – VALUE FUNDS

HSBC Value Fund

5

110.9

14873

1.5

0.6

4.3

20.5

19.0

16.3

0.57

EQUITY – DIVIDEND YIELD FUNDS

ICICI Pru Dividend Yield Equity Fund

5

52.3

6458

1.8

0.6

1.3

19.6

20.2

16.2

0.75

HYBRID – AGGRESSIVE HYBRID FUNDS

ICICI Prudential Equity & Debt Fund

5

396.2

50368

1.5

1.0

2.4

16.6

17.3

15.7

0.81

EQUITY – LARGE & MID CAP FUNDS

ICICI Prudential Large & Mid Cap Fund

5

989.3

29757

2.0

1.2

0.2

18.0

18.4

15.8

0.66

EQUITY – LARGE CAP FUNDS

ICICI Prudential Large Cap Fund

5

105.6

75650

1.7

1.2

-3.4

14.2

14.2

14.1

0.49

EQUITY – SECTOR – PHARMA FUNDS

ICICI Prudential P.H.D Fund

5

41.9

6669

2.4

1.6

10.4

28.5

16.4

0.55

HYBRID – CONSERVATIVE HYBRID FUNDS

ICICI Prudential Regular Savings Fund

5

77.6

3289

1.7

1.0

3.8

9.2

8.5

9.2

0.86

EQUITY – VALUE FUNDS

ICICI Prudential Value Fund

5

457.4

59588

1.6

1.2

-1.2

16.7

17.6

15.1

0.70

EQUITY – FLEXI CAP FUNDS

JM Flexicap Fund

5

93.7

5041

2.6

1.4

-3.5

17.9

17.4

16.6

0.50

HYBRID – CONSERVATIVE HYBRID FUNDS

Kotak Debt Hybrid Fund

5

58.3

2902

1.7

0.5

-0.3

8.2

8.2

8.9

0.63

EQUITY – THEMATIC – CONSUMPTION FUNDS

Nippon India Consumption Fund

5

182.9

2443

1.7

0.6

-7.1

12.0

15.0

12.8

0.46

EQUITY – LARGE CAP FUNDS

Nippon India Large Cap Fund

5

87.3

51690

1.2

0.6

-1.8

14.5

16.3

14.7

0.56

EQUITY – SMALL CAP FUNDS

Nippon India Small Cap Fund

5

171.7

72673

1.2

0.6

6.1

20.1

22.0

20.7

0.58

EQUITY – FLEXI CAP FUNDS

Parag Parikh Flexi Cap Fund

5

82.7

140950

1.1

0.5

0.1

16.1

15.7

17.1

0.59

HYBRID – AGGRESSIVE HYBRID FUNDS

Quant Aggressive Hybrid Fund

5

449.7

2024

2.1

0.8

9.1

14.4

13.8

15.7

0.48

EQUITY – TAX SAVING (ELSS) FUNDS

Quant ELSS Tax Saver Fund

5

384.9

12506

1.8

0.8

8.5

17.4

16.2

19.4

0.45

EQUITY – MID CAP FUNDS

Quant Mid Cap Fund

5

214.0

7905

1.8

0.9

-2.1

17.0

17.1

16.6

0.50

EQUITY – SMALL CAP FUNDS

Quant Small Cap Fund

5

260.8

30374

1.7

0.8

5.5

19.9

20.3

19.0

0.52

EQUITY – TAX SAVING (ELSS) FUNDS

SBI ELSS Tax Saver Fund

5

424.5

31094

1.6

1.0

-1.4

19.4

17.9

14.7

0.59

EQUITY – SECTOR – IT FUNDS

SBI Technology Opportunities Fund

5

182.4

4240

1.9

0.9

-14.1

9.5

10.7

14.8

0.28

HYBRID – EQUITY SAVINGS FUNDS

Sundaram Equity Savings Fund

5

70.1

1079

2.2

0.8

0.7

9.5

9.6

9.2

0.56

EQUITY – SECTOR – BANKING FUNDS

Sundaram Financial Services Opportunities

5

103.1

1613

2.1

0.8

-0.2

14.3

14.8

14.5

0.42

HYBRID – BALANCED ADVANTAGE FUNDS

Aditya Birla SL Bal Advantage

4

108.0

9182

1.5

0.6

2.7

11.5

10.1

10.9

0.52

EQUITY – LARGE & MID CAP FUNDS

Axis Large & Mid Cap Fund

4

32.8

15582

1.4

0.5

3.8

16.7

14.7

0.41

EQUITY – SMALL CAP FUNDS

AXIS Small Cap Fund

4

106.3

27364

1.4

0.4

4.8

17.1

17.8

18.0

0.54

EQUITY – TAX SAVING (ELSS) FUNDS

Bandhan ELSS Tax Saver Fund

4

150.0

6835

1.6

0.6

0.2

12.6

13.9

14.7

0.43

EQUITY – VALUE FUNDS

Bandhan Value Fund

4

144.1

9907

1.5

0.6

-1.6

13.9

16.0

15.4

0.50

EQUITY – TAX SAVING (ELSS) FUNDS

Bank of India ELSS Tax Saver

4

160.8

1403

1.8

0.8

2.6

15.7

14.7

16.1

0.40

EQUITY – SMALL CAP FUNDS

Bank of India Small Cap Fund

4

49.1

2168

1.7

0.5

11.1

21.0

19.9

0.49

HYBRID – AGGRESSIVE HYBRID FUNDS

Baroda BNP Paribas Aggressive Hybrid

4

27.5

1239

1.9

0.5

-0.3

12.3

11.2

0.41

EQUITY – THEMATIC – CONSUMPTION FUNDS

Baroda BNPP India Consumption Fund

4

29.3

1419

1.8

0.6

-5.3

11.6

12.6

0.35

EQUITY – THEMATIC – CONSUMPTION FUNDS

Canara Robeco Consumption Fund

4

102.1

1901

1.8

0.7

-5.8

11.8

13.3

15.2

0.37

EQUITY – TAX SAVING (ELSS) FUNDS

Canara Robeco ELSS Tax Saver

4

171.4

8529

1.5

0.6

-0.5

12.6

12.5

14.5

0.39

EQUITY – SECTOR – PHARMA FUNDS

DSP Healthcare Fund

4

40.2

3142

1.9

0.6

8.9

22.4

14.2

0.43

HYBRID – AGGRESSIVE HYBRID FUNDS

Edelweiss Aggressive Hybrid Fund

4

63.1

3627

1.9

0.5

1.1

14.5

14.3

12.6

0.58

HYBRID – BALANCED ADVANTAGE FUNDS

Edelweiss Balanced Advantage Fund

4

51.2

12906

2.1

1.0

2.3

10.9

10.0

10.9

0.44

EQUITY – FLEXI CAP FUNDS

Edelweiss Flexi Cap Fund

4

37.7

3320

1.9

0.5

1.5

16.1

14.9

14.8

0.44

EQUITY – DIVIDEND YIELD FUNDS

Franklin India Dividend Yield Fund

4

135.4

2306

2.0

1.3

-2.1

14.3

15.6

15.3

0.61

EQUITY – FLEXI CAP FUNDS

Franklin India Flexi Cap Fund

4

1539.7

19049

1.7

1.0

-5.5

14.7

14.6

13.3

0.46

EQUITY – TAX SAVING (ELSS) FUNDS

HDFC ELSS Tax saver

4

1323.4

15559

1.7

1.1

-5.1

16.4

17.6

14.0

0.62

HYBRID – EQUITY SAVINGS FUNDS

HDFC Equity Savings Fund

4

66.4

5718

1.9

1.0

1.7

8.7

8.8

9.5

0.59

HYBRID – CONSERVATIVE HYBRID FUNDS

HDFC Hybrid Debt Fund

4

82.0

3261

1.8

1.2

-0.4

8.0

8.3

8.5

0.72

EQUITY – LARGE CAP FUNDS

HDFC Large Cap Fund

4

1081.5

38121

1.6

1.0

-4.5

11.5

13.1

13.1

0.44

HYBRID – BALANCED ADVANTAGE FUNDS

ICICI Prudential Balanced Advantage Fund

4

75.3

70551

1.4

0.9

3.5

11.6

11.0

11.1

0.65

EQUITY – SECTOR – IT FUNDS

ICICI Prudential Technology Fund

4

164.9

13068

2.1

1.4

-17.0

8.0

8.3

14.9

0.22

EQUITY – SECTOR – BANKING FUNDS

Invesco India Financial Services Fund

4

140.9

1673

1.8

0.7

6.5

18.3

15.9

15.6

0.43

EQUITY – MID CAP FUNDS

Invesco India Midcap Fund

4

181.0

11767

1.5

0.5

8.7

25.0

21.3

18.2

0.56

EQUITY – SMALL CAP FUNDS

Invesco India Smallcap Fund

4

42.4

11038

1.5

0.4

7.7

23.4

21.8

0.56

HYBRID – AGGRESSIVE HYBRID FUNDS

JM Aggressive Hybrid Fund

4

114.3

701

2.9

1.4

-2.8

16.0

13.9

12.1

0.48

EQUITY – TAX SAVING (ELSS) FUNDS

JM ELSS Tax Saver Fund

4

47.5

220

2.6

1.3

1.5

16.9

15.5

15.8

0.44

EQUITY – LARGE CAP FUNDS

JM Large Cap Fund

4

147.0

422

2.8

1.3

-2.1

12.5

12.1

11.1

0.36

HYBRID – AGGRESSIVE HYBRID FUNDS

Kotak Aggressive Hybrid Fund

4

62.6

8642

1.8

0.5

4.0

13.6

13.0

12.9

0.48

HYBRID – EQUITY SAVINGS FUNDS

Kotak Equity Savings Fund

4

27.0

10032

1.7

0.7

5.1

10.3

10.0

9.3

0.68

EQUITY – LARGE CAP FUNDS

Kotak Large Cap Fund

4

545.6

10599

1.7

0.7

-3.8

11.7

11.8

12.4

0.37

EQUITY – MID CAP FUNDS

Mahindra Manulife Mid Cap Fund

4

34.8

4688

2.3

0.9

7.7

23.6

19.8

0.56

EQUITY – TAX SAVING (ELSS) FUNDS

Mirae Asset ELSS Tax Saver Fund

4

48.0

25267

1.4

0.6

1.2

14.4

13.2

16.9

0.40

HYBRID – EQUITY SAVINGS FUNDS

Mirae Asset Equity Savings Fund

4

20.8

1918

1.2

0.3

4.0

10.2

9.4

0.57

EQUITY – MID CAP FUNDS

Motilal Oswal Midcap Fund

4

90.8

35735

1.6

0.8

-8.3

19.8

22.9

16.3

0.59

EQUITY – SECTOR – BANKING FUNDS

Nippon India Banking & Financial Services

4

617.7

7470

1.5

0.8

0.3

13.8

15.8

14.1

0.46

EQUITY – MID CAP FUNDS

Nippon India Growth Mid Cap Fund

4

4334.2

45820

1.3

0.6

9.2

24.3

22.1

18.8

0.65

EQUITY – VALUE FUNDS

Nippon India Value Fund

4

219.7

8919

1.5

0.9

-0.9

19.1

17.4

15.9

0.54

EQUITY – FLEXI CAP FUNDS

PGIM India Flexi Cap Fund

4

35.0

5793

1.8

0.5

-1.2

10.4

10.3

13.9

0.30

EQUITY – LARGE & MID CAP FUNDS

Quant Large & Mid Cap Fund

4

119.3

3249

2.0

0.7

4.1

17.9

16.3

15.8

0.45

HYBRID – CONSERVATIVE HYBRID FUNDS

SBI Conservative Hybrid Fund

4

75.2

9754

1.5

1.1

4.8

9.1

9.1

8.8

0.84

EQUITY – LARGE & MID CAP FUNDS

SBI Large & Midcap Fund

4

625.8

38426

1.7

1.0

4.3

15.5

16.1

14.9

0.54

EQUITY – LARGE CAP FUNDS

SBI Large Cap Fund

4

90.6

53468

1.5

0.8

-0.7

10.9

12.0

12.1

0.39

EQUITY – FLEXI CAP FUNDS

Union Flexi Cap Fund

4

49.4

2294

1.7

0.8

-1.1

12.8

12.9

13.1

0.38

HYBRID – AGGRESSIVE HYBRID FUNDS

UTI Aggressive Hybrid Fund

4

396.3

6524

1.9

1.2

-1.0

13.4

13.3

12.1

0.55

HYBRID – EQUITY SAVINGS FUNDS

UTI Equity Savings Fund

4

18.6

820

1.7

0.8

2.2

9.0

9.0

0.63

EQUITY – LARGE & MID CAP FUNDS

UTI Large & Mid Cap Fund

4

179.9

5896

1.9

1.0

3.0

19.3

17.0

14.4

0.56

EQUITY – SECTOR – BANKING FUNDS

Aditya Birla SL Bank & Fin Serv

3

60.1

3541

1.7

0.9

0.5

12.4

12.6

13.1

0.34

EQUITY – THEMATIC – CONSUMPTION FUNDS

ABSL Consumption Fund

3

199.3

5996

1.6

0.7

-6.2

10.8

12.4

13.8

0.36

EQUITY – FLEXI CAP FUNDS

Aditya Birla Sun Life Flexi Cap Fund

3

1824.9

25632

1.4

0.7

3.6

16.7

13.5

14.2

0.41

EQUITY – LARGE CAP FUNDS

Aditya Birla Sun Life Large Cap Fund

3

497.6

28970

1.4

0.8

-4.5

11.6

12.0

12.0

0.38

HYBRID – CONSERVATIVE HYBRID FUNDS

Aditya Birla Sun Life Regular Savings Fund

3

68.6

1479

1.5

0.8

3.7

8.3

8.2

8.4

0.68

HYBRID – BALANCED ADVANTAGE FUNDS

Axis Balanced Advantage Fund

3

20.9

3764

1.6

0.5

-0.1

12.3

10.5

0.51

HYBRID – EQUITY SAVINGS FUNDS

Axis Equity Savings Fund

3

22.4

866

2.0

0.9

2.0

8.9

8.0

8.3

0.42

EQUITY – MID CAP FUNDS

Axis Midcap Fund

3

114.9

32276

1.3

0.4

6.2

18.4

15.8

16.7

0.45

HYBRID – AGGRESSIVE HYBRID FUNDS

Bandhan Aggressive Hybrid Fund

3

26.4

1919

1.8

0.5

5.4

14.2

12.8

0.45

EQUITY – FLEXI CAP FUNDS

Bandhan Flexi Cap Fund

3

203.4

7285

1.5

0.9

-0.7

13.8

12.6

11.0

0.38

EQUITY – LARGE CAP FUNDS

Bandhan Large Cap Fund

3

74.7

2007

1.8

0.8

-0.9

13.3

12.6

12.7

0.38

EQUITY – LARGE & MID CAP FUNDS

BOI Large & Mid Cap Equity Fund

3

89.6

468

2.1

1.0

5.1

15.8

14.5

12.9

0.43

EQUITY – TAX SAVING (ELSS) FUNDS

Baroda BNP Paribas ELSS Tax Saver

3

94.9

887

2.0

0.9

2.0

16.6

13.2

12.5

0.39

EQUITY – LARGE CAP FUNDS

Baroda BNP Paribas Large Cap Fund

3

214.5

2579

1.7

0.7

-1.7

13.2

12.8

12.5

0.40

EQUITY – MID CAP FUNDS

Baroda BNP Paribas Mid Cap Fund

3

107.7

2389

1.7

0.5

10.1

20.7

17.9

15.8

0.52

HYBRID – CONSERVATIVE HYBRID FUNDS

Canara Robeco Conservative Hybrid Fund

3

96.6

864

1.5

0.6

0.3

6.8

6.5

7.7

0.44

HYBRID – AGGRESSIVE HYBRID FUNDS

Canara Robeco Equity Hybrid Fund

3

355.0

11024

1.5

0.5

0.3

11.5

10.9

12.3

0.41

EQUITY – FLEXI CAP FUNDS

Canara Robeco Flexi Cap Fund

3

328.1

13083

1.5

0.5

-0.9

12.4

12.2

14.1

0.37

EQUITY – LARGE & MID CAP FUNDS

Canara Robeco Large and Mid Cap Fund

3

242.5

24675

1.4

0.5

-3.5

13.6

13.3

14.9

0.40

HYBRID – AGGRESSIVE HYBRID FUNDS

DSP Aggressive Hybrid Fund

3

343.3

11582

1.7

0.7

-4.0

12.6

10.9

12.1

0.38

HYBRID – BALANCED ADVANTAGE FUNDS

DSP Dynamic Asset Allocation Fund

3

28.0

3661

1.9

0.7

2.8

10.8

8.4

8.9

0.45

HYBRID – EQUITY SAVINGS FUNDS

DSP Equity Savings Fund

3

22.1

3541

1.5

0.7

2.0

9.0

8.2

8.1

0.62

EQUITY – FLEXI CAP FUNDS

DSP Flexi Cap Fund

3

98.5

11769

1.7

0.7

-2.6

13.8

12.1

14.2

0.34

EQUITY – LARGE & MID CAP FUNDS

DSP Large & Mid Cap Fund

3

599.9

17331

1.7

0.7

-1.6

17.1

14.5

15.1

0.47

HYBRID – CONSERVATIVE HYBRID FUNDS

DSP Regular Savings Fund

3

59.9

179

1.2

0.5

2.5

8.9

7.5

7.1

0.59

EQUITY – SMALL CAP FUNDS

DSP Small Cap Fund

3

201.6

17906

1.7

0.8

10.5

19.6

18.8

16.4

0.51

EQUITY – LARGE & MID CAP FUNDS

Edelweiss Large & Mid Cap Fund

3

86.6

4531

1.9

0.5

2.9

16.4

15.0

14.8

0.46

EQUITY – LARGE CAP FUNDS

Edelweiss Large Cap Fund

3

80.0

1439

2.1

0.7

-3.9

11.1

11.7

12.5

0.36

HYBRID – AGGRESSIVE HYBRID FUNDS

Franklin India Aggressive Hybrid Fund

3

259.6

2306

2.2

1.1

-3.2

11.9

11.0

10.9

0.42

HYBRID – CONSERVATIVE HYBRID FUNDS

Franklin India Conservative Hybrid Fund

3

90.7

188

1.4

0.7

0.6

8.0

6.9

7.1

0.48

EQUITY – TAX SAVING (ELSS) FUNDS

Franklin India ELSS Tax Saver Fund

3

1368.3

6106

1.8

1.1

-7.1

14.1

14.1

12.5

0.44

EQUITY – LARGE CAP FUNDS

Franklin India Large Cap Fund

3

970.1

7236

2.2

1.6

-4.3

11.0

9.6

10.7

0.31

EQUITY – SECTOR – IT FUNDS

Franklin India Technology Fund

3

439.4

1648

2.1

1.1

-13.0

13.5

10.2

14.4

0.23

HYBRID – AGGRESSIVE HYBRID FUNDS

HDFC Hybrid Equity Fund

3

110.1

22297

1.7

1.0

-6.3

7.4

10.0

10.9

0.38

EQUITY – SMALL CAP FUNDS

HDFC Small Cap Fund

3

132.0

38168

1.6

0.8

0.7

15.1

18.4

17.4

0.51

EQUITY – VALUE FUNDS

HDFC Value Fund

3

736.0

7324

1.9

1.0

1.9

17.2

15.8

14.0

0.50

HYBRID – BALANCED ADVANTAGE FUNDS

HSBC Balanced Advantage Fund

3

42.7

1506

1.8

0.7

-0.2

9.4

8.0

8.2

0.36

HYBRID – CONSERVATIVE HYBRID FUNDS

HSBC Conservative Hybrid Fund

3

61.8

146

1.8

1.0

1.3

8.6

7.5

7.4

0.44

HYBRID – EQUITY SAVINGS FUNDS

HSBC Equity Savings Fund

3

35.6

905

1.3

0.6

10.1

13.2

11.4

9.3

0.53

EQUITY – FLEXI CAP FUNDS

HSBC Flexi Cap Fund

3

219.1

5405

1.6

0.9

3.1

17.6

15.5

13.2

0.42

EQUITY – SECTOR – BANKING FUNDS

ICICI Prudential Banking & Financial Services

3

126.9

10589

2.2

1.4

-3.6

10.7

11.7

13.6

0.34

EQUITY – TAX SAVING (ELSS) FUNDS

ICICI Pru Long Term Equity

3

897.0

13911

1.7

1.1

-2.1

13.5

13.0

12.9

0.43

EQUITY – MID CAP FUNDS

ICICI Prudential Midcap Fund

3

333.6

7557

1.8

1.0

19.0

25.7

20.7

17.5

0.61

EQUITY – SMALL CAP FUNDS

ICICI Prudential Smallcap Fund

3

85.0

8741

1.8

0.8

2.4

14.5

17.5

16.1

0.55

HYBRID – BALANCED ADVANTAGE FUNDS

Invesco India Balanced Advantage Fund

3

51.1

1024

1.8

0.7

-3.8

9.3

8.5

9.3

0.32

EQUITY – LARGE & MID CAP FUNDS

Invesco India Large & Mid Cap Fund

3

99.1

9761

1.5

0.5

4.8

22.5

18.1

16.1

0.49

EQUITY – LARGE CAP FUNDS

Invesco India Largecap Fund

3

67.0

1722

1.8

0.7

-1.4

14.3

13.5

12.7

0.40

EQUITY – VALUE FUNDS

JM Value Fund

3

90.9

826

3.0

1.8

-6.0

16.9

16.5

16.0

0.47

HYBRID – BALANCED ADVANTAGE FUNDS

Kotak Balanced Advantage Fund

3

20.3

17184

1.7

0.6

-0.4

9.4

9.0

0.42

EQUITY – TAX SAVING (ELSS) FUNDS

Kotak ELSS Tax Saver Fund

3

110.2

6112

1.8

0.7

-3.2

12.2

13.2

14.1

0.39

EQUITY – FLEXI CAP FUNDS

Kotak Flexicap Fund

3

82.7

54839

1.4

0.6

-0.3

13.9

13.0

13.8

0.39

EQUITY – LARGE & MID CAP FUNDS

Kotak Large & Midcap Fund

3

335.8

30251

1.6

0.6

1.6

15.9

15.5

15.4

0.47

EQUITY – MID CAP FUNDS

Kotak Midcap Fund

3

137.7

63539

1.4

0.4

8.5

20.8

18.9

17.7

0.55

EQUITY – SMALL CAP FUNDS

Kotak Small Cap Fund

3

254.0

17416

1.7

0.6

2.4

14.6

15.4

16.7

0.41

EQUITY – DIVIDEND YIELD FUNDS

LIC MF Dividend Yield Fund

3

30.8

661

2.5

1.1

2.5

20.3

16.6

0.48

EQUITY – TAX SAVING (ELSS) FUNDS

Mahindra Manulife ELSS Tax Saver Fund

3

26.7

889

2.2

0.8

-5.3

10.5

12.2

0.37

HYBRID – EQUITY SAVINGS FUNDS

Mahi Manu Eq Sav Dhan San Yojana

3

21.0

531

2.4

0.8

3.6

9.4

8.6

0.44

HYBRID – AGGRESSIVE HYBRID FUNDS

Mirae Asset Aggressive Hybrid Fund

3

32.4

9363

1.5

0.4

2.7

12.1

11.3

12.5

0.42

EQUITY – THEMATIC – CONSUMPTION FUNDS

Mirae Asset Great Consumer

3

87.1

4455

1.6

0.4

-3.7

12.0

13.9

15.3

0.39

EQUITY – SECTOR – PHARMA FUNDS

Mirae Asset Healthcare Fund

3

42.2

2939

1.7

0.5

14.6

26.1

15.1

0.46

EQUITY – LARGE & MID CAP FUNDS

Mirae Asset Large & Midcap Fund

3

149.8

42338

1.3

0.5

3.3

15.1

13.3

16.9

0.39

EQUITY – LARGE CAP FUNDS

Mirae Asset Large Cap Fund

3

107.0

38239

1.3

0.5

-3.6

9.7

10.4

12.9

0.32

EQUITY – TAX SAVING (ELSS) FUNDS

Motilal Oswal ELSS Tax Saver Fund

3

54.2

4659

2.0

0.8

8.9

23.8

19.8

17.1

0.47

HYBRID – BALANCED ADVANTAGE FUNDS

Nippon India Balanced Advantage Fund

3

176.8

9620

1.5

0.5

1.2

10.9

9.9

11.0

0.50

EQUITY – SECTOR – PHARMA FUNDS

Nippon India Pharma Fund

3

544.9

8365

1.5

0.8

9.7

24.1

13.7

15.1

0.43

EQUITY – LARGE & MID CAP FUNDS

Nippon India Vision Large & Mid Cap Fund

3

1445.5

7081

1.5

1.0

0.8

18.2

16.6

13.4

0.51

EQUITY – MID CAP FUNDS

PGIM India Midcap Fund

3

62.8

10738

1.7

0.5

1.2

12.7

13.8

15.6

0.40

EQUITY – TAX SAVING (ELSS) FUNDS

Quantum ELSS Tax Saver Fund

3

116.2

209

2.1

0.9

-5.9

12.9

11.8

11.5

0.41

EQUITY – SECTOR – BANKING FUNDS

SBI Banking & Financial Services Fund

3

42.3

10375

2.0

1.1

3.9

16.4

13.9

15.7

0.38

EQUITY – THEMATIC – CONSUMPTION FUNDS

SBI Consumption Opportunities Fund

3

284.1

2933

2.5

1.5

-8.2

9.6

14.7

14.2

0.45

HYBRID – AGGRESSIVE HYBRID FUNDS

SBI Equity Hybrid Fund

3

304.6

83353

1.3

0.7

3.3

13.5

11.8

12.2

0.49

HYBRID – EQUITY SAVINGS FUNDS

SBI Equity Savings Fund

3

24.3

5700

1.5

0.9

2.9

10.0

8.9

8.7

0.53

EQUITY – FLEXI CAP FUNDS

SBI Flexicap Fund

3

105.1

22403

2.3

1.5

-1.6

10.0

10.6

12.1

0.32

EQUITY – SECTOR – PHARMA FUNDS

SBI Healthcare Opportunities Fund

3

461.3

4323

1.9

0.9

10.3

26.1

15.9

12.8

0.54

EQUITY – MID CAP FUNDS

SBI Midcap Fund

3

234.5

23247

1.6

0.9

1.3

14.7

16.6

14.1

0.50

HYBRID – AGGRESSIVE HYBRID FUNDS

Sundaram Aggressive Hybrid Fund

3

155.9

8484

1.7

0.7

-2.9

10.6

10.5

12.0

0.39

EQUITY – TAX SAVING (ELSS) FUNDS

Sundaram ELSS Tax Saver Fund

3

485.0

1296

2.2

1.6

-2.6

12.0

12.7

13.6

0.41

EQUITY – MID CAP FUNDS

Sundaram Mid Cap Fund

3

1420.4

13378

1.7

0.9

7.3

23.1

19.9

15.0

0.57

EQUITY – SMALL CAP FUNDS

Sundaram Small Cap Fund

3

272.5

3563

1.9

0.9

9.9

20.0

19.0

14.7

0.49

HYBRID – AGGRESSIVE HYBRID FUNDS

Tata Aggressive Hybrid Fund

3

421.8

3865

1.9

1.0

-2.2

8.7

10.3

9.6

0.37

EQUITY – SECTOR – BANKING FUNDS

Tata Banking and Financial Services Fund

3

41.9

3043

1.9

0.6

-0.5

12.9

12.8

14.7

0.35

EQUITY – TAX SAVING (ELSS) FUNDS

Tata ELSS Fund

3

44.9

4519

1.8

0.8

3.4

14.7

14.2

13.9

0.43

EQUITY – FLEXI CAP FUNDS

Tata Flexi Cap Fund

3

23.4

3633

1.9

0.6

-2.0

13.7

11.9

0.36

EQUITY – THEMATIC – CONSUMPTION FUNDS

Tata India Consumer Fund

3

44.1

2591

2.0

0.8

1.6

16.0

15.3

16.0

0.42

EQUITY – LARGE CAP FUNDS

Tata Large Cap Fund

3

490.0

2688

2.0

1.0

-1.5

11.9

12.2

12.0

0.38

EQUITY – MID CAP FUNDS

Tata Mid Cap Fund

3

443.5

5604

1.9

0.7

8.0

19.9

17.5

16.2

0.52

EQUITY – SMALL CAP FUNDS

Tata Small Cap Fund

3

35.1

11330

1.7

0.4

-7.2

12.2

16.5

0.45

EQUITY – VALUE FUNDS

Templeton India Value Fund

3

687.7

2150

2.2

1.1

-3.2

13.6

16.5

14.3

0.56

HYBRID – BALANCED ADVANTAGE FUNDS

Union Balanced Advantage Fund

3

19.9

1241

1.9

0.9

-0.3

8.1

7.3

0.29

EQUITY – TAX SAVING (ELSS) FUNDS

Union ELSS Tax Saver Fund

3

62.6

841

2.0

1.2

-0.5

12.7

13.5

12.6

0.41

EQUITY – SMALL CAP FUNDS

Union Small Cap Fund

3

53.3

1980

1.8

0.8

17.6

20.8

19.1

16.2

0.47

EQUITY – VALUE FUNDS

Union Value Fund

3

27.8

373

2.1

1.1

1.3

16.1

15.2

0.49

HYBRID – CONSERVATIVE HYBRID FUNDS

UTI Conservative Hybrid Fund

3

69.1

1652

2.0

1.4

0.0

8.0

8.2

7.7

0.62

EQUITY – DIVIDEND YIELD FUNDS

UTI Dividend Yield Fund

3

173.8

3750

2.4

1.9

1.1

17.4

14.6

14.4

0.50

EQUITY – LARGE CAP FUNDS

UTI Large Cap Fund

3

256.0

12053

1.9

1.2

-5.9

9.4

9.6

11.5

0.28

EQUITY – VALUE FUNDS

UTI Value Fund

3

160.4

9433

2.1

1.5

-2.3

15.6

14.0

13.7

0.45

EQUITY – DIVIDEND YIELD FUNDS

ABSL Dividend Yield Fund

2

453.2

1475

1.8

1.1

4.5

17.4

16.6

13.4

0.54

EQUITY – SECTOR – IT FUNDS

Aditya Birla Sun Life Digital India Fund

2

140.5

3799

1.6

0.8

-16.9

6.1

7.3

14.5

0.18

HYBRID – AGGRESSIVE HYBRID FUNDS

Aditya Birla Sun Life Equity Hybrid ’95 Fund

2

1472.9

6999

1.5

0.9

-1.7

11.0

9.9

10.0

0.33

HYBRID – EQUITY SAVINGS FUNDS

Aditya Birla Sun Life Equity Savings

2

22.8

1087

0.9

0.5

5.1

8.6

7.3

7.9

0.34

EQUITY – MID CAP FUNDS

Aditya Birla Sun Life Midcap Fund

2

795.0

6290

1.6

0.9

5.1

19.2

17.2

13.8

0.50

EQUITY – VALUE FUNDS

Aditya Birla Sun Life Value Fund

2

129.4

6388

1.6

0.9

6.8

18.8

15.4

12.7

0.42

HYBRID – CONSERVATIVE HYBRID FUNDS

Axis Conservative Hybrid Fund

2

30.0

218

1.9

0.9

-0.2

5.9

5.8

6.4

0.30

EQUITY – FLEXI CAP FUNDS

Axis Flexi Cap Fund

2

25.7

12546

1.5

0.5

-1.4

12.8

10.6

0.28

HYBRID – BALANCED ADVANTAGE FUNDS

Bandhan Balanced Advantage Fund

2

24.4

2209

1.7

0.6

2.2

9.6

8.3

8.7

0.32

HYBRID – BALANCED ADVANTAGE FUNDS

Bank of India Balanced Advantage Fund

2

25.7

153

2.1

1.1

4.3

10.1

10.4

7.3

0.44

EQUITY – SECTOR – BANKING FUNDS

Baroda BNP Paribas Bank&Fin Serv

2

46.7

389

2.1

0.7

-0.9

13.3

12.3

12.3

0.32

HYBRID – CONSERVATIVE HYBRID FUNDS

Baroda BNP Paribas Conser Hybrid

2

45.5

811

1.8

0.5

2.3

7.5

6.6

7.0

0.42

EQUITY – LARGE CAP FUNDS

DSP Large Cap Fund

2

450.2

7192

1.8

0.9

-4.7

13.7

11.9

11.6

0.39

EQUITY – TAX SAVING (ELSS) FUNDS

Edelweiss Long Term Equity

2

111.2

437

2.4

0.8

3.5

14.7

13.6

12.5

0.41

HYBRID – EQUITY SAVINGS FUNDS

Franklin India Equity Savings Fund

2

16.7

633

1.1

0.4

3.1

7.7

7.5

0.49

EQUITY – LARGE & MID CAP FUNDS

Franklin India Large & Mid Cap Fund

2

181.6

3399

2.8

2.2

-2.0

13.8

12.7

11.5

0.39

EQUITY – MID CAP FUNDS

Franklin India Mid Cap Fund

2

2657.5

12102

1.8

1.0

-0.4

19.3

16.3

14.5

0.46

EQUITY – SMALL CAP FUNDS

Franklin India Small Cap Fund

2

169.5

13850

1.8

1.0

1.5

17.6

19.5

15.3

0.51

HYBRID – AGGRESSIVE HYBRID FUNDS

HSBC Aggressive Hybrid Fund

2

56.0

5424

1.6

0.7

5.5

13.8

11.4

11.1

0.33

EQUITY – TAX SAVING (ELSS) FUNDS

HSBC ELSS Tax saver Fund

2

133.1

3939

1.6

1.0

1.9

17.1

14.4

13.6

0.40

EQUITY – LARGE CAP FUNDS

HSBC Large Cap Fund

2

454.1

1784

1.8

1.0

-2.6

11.5

11.2

12.1

0.32

EQUITY – SMALL CAP FUNDS

HSBC Small Cap Fund

2

81.4

16394

1.4

0.6

5.0

16.9

19.8

18.4

0.48

HYBRID – EQUITY SAVINGS FUNDS

ICICI Prudential Equity Savings Fund

2

23.0

16868

1.0

2.9

7.6

7.3

8.0

0.88

HYBRID – AGGRESSIVE HYBRID FUNDS

Invesco India Aggressive Hybrid Fund

2

20.6

762

2.0

0.7

-7.8

11.5

10.4

0.34

EQUITY – TAX SAVING (ELSS) FUNDS

Invesco India ELSS Tax Saver Fund

2

115.7

2542

1.7

0.8

-5.5

13.1

11.4

12.8

0.30

EQUITY – LARGE & MID CAP FUNDS

LIC MF Large & Midcap Fund

2

37.0

2958

2.0

0.9

-2.4

15.4

13.8

14.3

0.41

EQUITY – LARGE CAP FUNDS

LIC MF Large Cap Fund

2

51.7

1352

2.2

1.1

-7.2

8.3

8.9

10.3

0.24

EQUITY – FLEXI CAP FUNDS

Motilal Oswal Flexi Cap Fund

2

55.3

12770

1.9

1.1

-7.8

18.1

12.3

12.2

0.33

HYBRID – AGGRESSIVE HYBRID FUNDS

Navi Aggressive Hybrid Fund

2

20.6

111

2.1

0.5

3.1

11.1

10.9

0.40

EQUITY – FLEXI CAP FUNDS

Navi Flexi Cap Fund

2

23.2

260

2.1

0.5

5.2

11.8

12.0

0.36

HYBRID – AGGRESSIVE HYBRID FUNDS

Nippon India Aggressive Hybrid Fund

2

103.3

3958

1.6

0.9

0.3

12.5

12.4

9.8

0.48

EQUITY – TAX SAVING (ELSS) FUNDS

Nippon India ELSS Tax Saver Fund

2

127.9

14742

1.5

0.9

1.9

16.2

15.2

11.4

0.47

EQUITY – TAX SAVING (ELSS) FUNDS

PGIM India ELSS Tax Saver Fund

2

32.5

700

2.3

0.8

-6.1

8.6

10.9

12.6

0.34

EQUITY – SMALL CAP FUNDS

SBI Small Cap Fund

2

165.1

37141

1.6

0.9

-0.6

12.4

14.5

17.4

0.44

HYBRID – BALANCED ADVANTAGE FUNDS

Sundaram Balanced Advantage Fund

2

34.4

1658

2.1

0.7

-1.7

8.8

8.1

7.5

0.33

EQUITY – THEMATIC – CONSUMPTION FUNDS

Sundaram Consumption Fund

2

88.5

1428

2.1

1.3

-8.6

11.5

12.7

11.9

0.36

EQUITY – LARGE & MID CAP FUNDS

Sundaram Large and Mid Cap Fund

2

83.6

6575

1.8

0.8

0.9

14.1

14.2

14.2

0.41

EQUITY – SECTOR – PHARMA FUNDS

Tata India Pharma & Healthcare Fund

2

31.7

1325

2.2

0.7

7.0

23.9

14.2

12.8

0.43

EQUITY – LARGE & MID CAP FUNDS

Tata Large & Mid Cap Fund

2

477.5

7802

1.8

0.7

-7.3

8.9

11.6

12.5

0.35

EQUITY – VALUE FUNDS

Tata Value Fund

2

340.2

8592

1.8

0.8

0.4

15.7

15.8

14.9

0.50

EQUITY – MID CAP FUNDS

Taurus Mid Cap Fund

2

115.4

123

2.6

2.2

-1.5

13.6

12.9

14.8

0.35

HYBRID – EQUITY SAVINGS FUNDS

Union Equity Savings Fund

2

16.9

142

1.7

1.3

1.8

7.1

6.4

0.32

EQUITY – LARGE CAP FUNDS

Union Largecap Fund

2

22.5

439

2.1

1.3

-3.4

9.9

10.5

0.31

EQUITY – SECTOR – BANKING FUNDS

UTI Banking and Financial Services Fund

2

186.2

1350

0.0

12.7

12.8

11.5

0.34

EQUITY – TAX SAVING (ELSS) FUNDS

UTI ELSS Tax Saver Fund

2

194.3

3438

2.1

1.2

-4.5

10.8

10.4

11.9

0.29

EQUITY – FLEXI CAP FUNDS

UTI Flexi Cap Fund

2

293.9

22168

1.6

1.0

-8.0

7.8

6.9

11.5

0.15

EQUITY – THEMATIC – CONSUMPTION FUNDS

UTI India Consumer Fund

2

54.7

674

2.5

1.7

-3.1

11.3

11.5

11.2

0.31

EQUITY – MID CAP FUNDS

UTI Mid Cap Fund

2

298.1

11680

2.1

1.3

3.6

16.0

15.1

14.1

0.42

EQUITY – TAX SAVING (ELSS) FUNDS

Aditya Birla Sun Life ELSS Tax Saver Fund

1

59.2

14378

1.5

0.8

1.3

13.5

9.5

10.6

0.27

EQUITY – LARGE & MID CAP FUNDS

Aditya Birla Sun Life Large & Mid Cap Fund

1

892.7

5648

1.6

0.9

1.8

13.2

10.5

11.8

0.26

EQUITY – SMALL CAP FUNDS

Aditya Birla Sun Life Small Cap Fund

1

89.8

5253

1.6

0.8

9.8

17.9

15.0

13.2

0.38

HYBRID – AGGRESSIVE HYBRID FUNDS

Axis Aggressive Hybrid Fund

1

19.9

1451

1.8

0.9

-1.8

9.4

8.8

0.28

EQUITY – TAX SAVING (ELSS) FUNDS

Axis ELSS Tax Saver Fund

1

91.8

31566

1.3

0.7

-3.5

11.3

8.6

11.8

0.20

EQUITY – LARGE CAP FUNDS

Axis Large Cap Fund

1

56.9

30498

1.3

0.6

-5.6

9.1

8.0

11.6

0.21

HYBRID – CONSERVATIVE HYBRID FUNDS

Bandhan Conservative Hybrid Fund

1

32.1

98

1.7

0.8

0.1

6.3

5.4

6.4

0.26

HYBRID – EQUITY SAVINGS FUNDS

Bandhan Equity Savings Fund

1

31.9

389

0.9

0.2

3.3

7.0

6.6

6.3

0.54

EQUITY – MID CAP FUNDS

DSP Midcap Fund

1

148.5

19459

1.7

0.7

5.5

19.0

13.7

14.9

0.39

EQUITY – LARGE CAP FUNDS

Groww Largecap Fund

1

41.4

128

2.5

1.3

-0.9

11.1

11.0

11.0

0.31

EQUITY – MID CAP FUNDS

HSBC Midcap Fund

1

429.0

13387

1.5

0.6

16.5

26.5

19.5

17.2

0.49

HYBRID – AGGRESSIVE HYBRID FUNDS

LIC MF Aggressive Hybrid Fund

1

192.0

509

2.4

1.3

-0.8

11.1

9.7

9.5

0.32

EQUITY – SECTOR – BANKING FUNDS

LIC MF Banking & Financial Services Fund

1

20.6

262

2.4

1.2

1.1

8.6

11.0

9.6

0.29

EQUITY – TAX SAVING (ELSS) FUNDS

LIC MF ELSS Tax Saver

1

140.7

994

2.2

1.0

-6.8

10.9

11.5

11.9

0.34

EQUITY – FLEXI CAP FUNDS

LIC MF Flexi Cap Fund

1

95.4

973

2.4

1.7

3.9

11.6

11.0

10.2

0.30

EQUITY – MID CAP FUNDS

LIC MF Midcap Fund

1

29.0

347

2.4

1.3

2.5

19.1

15.2

0.40

EQUITY – SMALL CAP FUNDS

LIC MF Small Cap Fund

1

31.1

660

2.8

1.5

6.8

18.1

18.7

0.46

EQUITY – VALUE FUNDS

LIC MF Value Fund

1

25.7

208

2.5

1.4

10.3

16.1

14.0

0.38

EQUITY – THEMATIC – CONSUMPTION FUNDS

Mahindra Manulife Consumption Fund

1

21.1

504

2.7

1.1

-4.8

11.1

11.9

0.34

HYBRID – BALANCED ADVANTAGE FUNDS

Motilal Oswal Balanced Advantage Fund

1

17.9

734

2.4

1.1

-4.0

5.1

4.4

0.08

EQUITY – LARGE & MID CAP FUNDS

Navi Large & Midcap Fund

1

34.8

300

2.1

0.5

0.0

11.1

12.3

12.5

0.35

HYBRID – CONSERVATIVE HYBRID FUNDS

Nippon India Conservative Hybrid Fund

1

60.5

951

1.5

0.9

5.9

7.9

7.9

5.7

1.02

HYBRID – EQUITY SAVINGS FUNDS

Nippon India Equity Savings Fund

1

16.2

853

1.3

0.4

2.3

6.7

7.2

4.7

0.47

HYBRID – AGGRESSIVE HYBRID FUNDS

PGIM India Aggressive Hybrid Equity Fund

1

125.5

204

2.3

0.8

-3.0

8.9

8.2

8.7

0.24

EQUITY – LARGE CAP FUNDS

PGIM India Large Cap Fund

1

319.6

544

2.4

0.9

-5.5

7.9

8.3

10.2

0.23

EQUITY – VALUE FUNDS

Quantum Value Fund

1

116.9

1114

2.1

1.1

-6.0

13.0

11.8

11.4

0.40

EQUITY – FLEXI CAP FUNDS

Shriram Flexi Cap Fund

1

19.1

128

2.1

0.7

-2.2

8.6

9.1

0.22

EQUITY – DIVIDEND YIELD FUNDS

Sundaram Dividend Yield Fund

1

131.0

856

2.3

1.1

-2.4

13.3

12.7

14.8

0.43

EQUITY – SECTOR – IT FUNDS

Tata Digital India Fund

1

37.7

9697

1.7

0.6

-20.6

6.4

7.6

14.0

0.19

EQUITY – FLEXI CAP FUNDS

Taurus Flexi Cap Fund

1

216.8

344

2.7

2.6

-2.0

12.2

11.2

9.9

0.32

EQUITY – SECTOR – PHARMA FUNDS

UTI Healthcare Fund

1

306.0

1144

2.3

1.4

12.2

26.8

14.3

13.3

0.44

HYBRID – BALANCED ADVANTAGE FUNDS

UTI-Unit Linked Insurance Plan

1

40.7

4923

1.6

1.0

-2.8

7.0

6.7

7.3

0.28

HYBRID – CONSERVATIVE HYBRID FUNDS

Bank of India Conservative Hybrid Fund

34.8

65

1.9

1.0

3.0

6.8

10.1

7.2

0.85

EQUITY – MULTI CAP FUNDS

Baroda BNP Paribas Multi Cap Fund

284.5

3219

1.7

0.8

2.8

16.8

16.4

14.6

0.45

EQUITY – SMALL CAP FUNDS

Canara Robeco Small Cap Fund

38.4

13276

1.5

0.5

3.5

15.2

17.9

0.51

EQUITY – SMALL CAP FUNDS

Edelweiss Small Cap Fund

44.3

5952

2.1

0.8

6.3

18.4

19.0

0.53

HYBRID – AGGRESSIVE HYBRID FUNDS

Groww Aggressive Hybrid Fund

20.1

50

2.5

1.5

-1.7

9.3

9.3

0.29

EQUITY – TAX SAVING (ELSS) FUNDS

Groww ELSS Tax Saver Fund

18.5

50

2.4

0.9

-4.1

10.5

10.3

0.28

EQUITY – VALUE FUNDS

Groww Value Fund

26.2

67

2.5

1.1

-1.0

14.7

13.1

10.3

0.40

EQUITY – LARGE & MID CAP FUNDS

HSBC Large & Mid Cap Fund

27.9

4877

1.6

0.7

9.2

19.5

16.5

0.40

EQUITY – MULTI CAP FUNDS

ICICI Prudential Multicap Fund

822.9

16997

1.7

0.9

5.7

19.4

17.6

15.2

0.58

EQUITY – CONTRA FUNDS

Invesco India Contra Fund

126.8

19406

1.4

0.5

-4.1

16.4

14.6

15.2

0.45

HYBRID – EQUITY SAVINGS FUNDS

Invesco India Equity Savings Fund

16.2

330

2.1

0.8

-3.5

8.3

6.8

0.30

EQUITY – MULTI CAP FUNDS

Invesco India Multicap Fund

121.8

3995

1.6

0.6

-5.1

14.7

13.9

13.3

0.38

EQUITY – CONTRA FUNDS

Kotak Contra Fund

146.4

5154

1.9

0.6

0.9

17.3

16.1

15.9

0.50

HYBRID – CONSERVATIVE HYBRID FUNDS

LIC MF Conservative Hybrid Fund

82.0

47

2.1

1.2

0.4

5.4

5.3

6.1

0.27

HYBRID – EQUITY SAVINGS FUNDS

LIC MF Equity Savings Fund

28.1

34

2.3

1.3

2.7

9.2

7.7

6.8

0.36

EQUITY – SECTOR – PHARMA FUNDS

LIC MF Healthcare Fund

30.9

85

2.4

1.1

10.2

23.5

11.3

0.32

EQUITY – LARGE CAP FUNDS

Mahindra Manulife Large Cap Fund

21.5

701

2.3

0.7

-6.7

10.6

10.2

0.31

EQUITY – MULTI CAP FUNDS

Mahindra Manulife Multi Cap Fund

36.3

6439

2.9

1.6

6.6

19.7

17.6

0.50

EQUITY – MULTI CAP FUNDS

Nippon India Multi Cap Fund

293.6

52634

1.2

0.6

2.4

18.7

20.8

15.9

0.66

HYBRID – EQUITY SAVINGS FUNDS

PGIM India Equity Savings Fund

49.9

60

1.3

0.6

2.1

6.1

6.4

6.8

0.51

EQUITY – FLEXI CAP FUNDS

Quant Flexi Cap Fund

103.2

6594

2.0

0.8

6.5

17.9

17.2

19.2

0.50

EQUITY – MULTI CAP FUNDS

Quant Multi Cap Fund

629.6

7466

1.9

0.7

2.1

12.6

12.9

17.1

0.34

EQUITY – CONTRA FUNDS

SBI Contra Fund

370.2

47352

1.5

0.7

-2.1

15.5

18.5

16.0

0.67

HYBRID – AGGRESSIVE HYBRID FUNDS

Shriram Aggressive Hybrid Fund

31.1

49

2.1

0.6

0.9

10.0

8.8

9.4

0.28

EQUITY – TAX SAVING (ELSS) FUNDS

Shriram ELSS Tax Saver Fund

20.0

46

2.1

0.6

-2.5

8.4

8.8

0.21

HYBRID – CONSERVATIVE HYBRID FUNDS

Sundaram Conservative Hybrid Fund

29.0

19

1.9

1.1

-2.7

5.1

6.5

6.2

0.45

EQUITY – MULTI CAP FUNDS

Sundaram Multi Cap Fund

364.7

2807

2.0

0.9

-1.0

14.7

15.0

14.7

0.45

EQUITY – VALUE FUNDS

Sundaram Value Fund

207.5

1323

2.2

1.6

-3.9

9.6

11.4

11.1

0.37

HYBRID – BALANCED ADVANTAGE FUNDS

Tata Balanced Advantage Fund

20.5

9128

1.7

0.5

1.3

9.1

9.2

0.45

EQUITY – SECTOR – BANKING FUNDS

Taurus Banking & Financial Services Fund

51.6

11

2.4

1.7

-3.4

8.9

11.3

12.8

0.30

EQUITY – TAX SAVING (ELSS) FUNDS

Taurus ELSS Tax Saver Fund

173.4

71

2.4

1.8

-4.6

12.2

12.2

13.0

0.40

EQUITY – LARGE CAP FUNDS

Taurus Large Cap Fund

154.0

51

2.4

2.2

-0.5

13.1

11.6

10.5

0.34


Source link

YouTube
Instagram
WhatsApp