
For every dollar inflow in physically-backed goldexchange-traded funds (ETFs) in March, there was an outflow of $2.3, according to data from the World Gold Council (WGC).
While investments in gold ETFs totalled $9.12 billion, investors chose to cash in $21.35 billion. Overall, gold ETFs witnessed more outflows in all four weeks of the month.
While outflows were the second-highest in the week ending March 28, inflows lagged behind those of the first two weeks. Gold has been at the receiving end since the US-Israel axis launched an offensive against Iran on February 27.
Interestingly, outflows were witnessed across the world in the fourth week compared to the earlier three weeks, when Asia bucked the trend to be positive. In the fourth week, exits from ETFs in Asia almost matched North America. In the fourth week, North America saw a flight of $1.58 billion, Europe $1.15 billion, Asia $1.52 billion and others $0.06 billion.
Down 15% in a month
Over the past month, gold prices has declined by 15 per cent. The precious metal has shed over 19 per cent after it peaked at $5,608 an ounce on January 30. It is currently ruling at $4,551.08 an ounce. On COMEX, June gold contracts are quoted at $4,580.42 an ounce.
Soaring crude oil prices, strengthening of the dollar, concerns over global inflation that could force banks to hike interest rates and fears of banks selling gold reserves have dragged the precious metal lower soon after the Iran war broke out.
US research agency BMI, an unit of Fitch Solutions, said it expects gold to remain under pressure in the second quarter and beyond. Hawkish US Fed sentiment and dollar strength will further dampen gold’s attractiveness.
Price forecast
However, BMI said it was maintaining its 2026 gold price forecast at an annual average of $4,600/oz. It expects prices to remain under pressure as the year progresses and the US-Iran war drags on.
Prices started the year at $4,331/oz on January 2, and averaged $4,899/oz in the year-to-date as of March 25, said BMI.
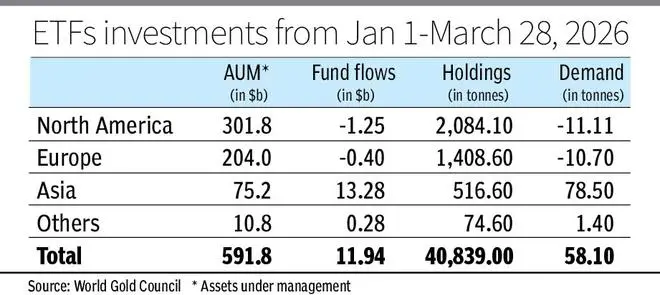
A look at the year-to-date data of WGC shows that gold is probably being held by Asian investors, particularly in India and China. As of March 28, inflows into gold ETFs exceeded $52.13 billion and outflows were $40.17 billion.
In North America and Europe, there was a net outflow of $1.23 billion and $0.40 billion, respectively. However, Asia has seen a net inflow of $13.29 billion, supporting gold prices.
China, India positive
Data show that China and India are the top investors in gold ETFs so far this year. Chinese investments in the ETFs were $7.93 billion, while in India, they were $3.13 billion. Japanese inflows were also positive at $1.02 billion.
However, in the fourth week, Chinese investors chose to exit ETFs with the outflow at $1.54 billion. Details of Indian investments were not available. Investors in France encashed $0.19 billion, Canadians and Australians took awau $0.05 billion each and Germans $0.03 billion. In terms of tonnage, the US and China witnessed a 10 per cent drop, while it was 6.8 per cent decline in the UK, where the outflow was almost $1 billion.
Nippon India ETF Gold BeES was among the top 10 global ETFs that witnessed inflows. Investments in the Indian fund were up at $1,09 billion. Four Chinese ETF funds were among the top 10, while SPDR Gold Minishares Trust topped with $2.62 billion in investments.
BMI said among institutions, the central bank of Turkiye sold 58-60 tonnes of gold (approximately $8bn) over two weeks in March 2026, and Russia sold 15-15.5 tonnes of the precious metal over January and February 2026.
Gold had a sparkling rally since 2024 due to the Ukraine War, US tariffs war against other nations, particularly China, Washington’s threat to annex Greenland, hopes of a fall in US Fed interest rates and the US capture of Venezuelan President Nicolas Maduro.
Published on March 31, 2026