- April 25, 2026 21:02
This live blog is now closed.
- April 25, 2026 18:55
IDFC FIRST Bank Q4-FY26 PAT up 5% at Rs. 319 crore, Normalized PAT excluding the isolated incident at Rs. 746 crore, up 145% YoY
- April 25, 2026 16:46
India Cements net up 4 times on better realisation, lower cost
India Cements net up 4 times on better realisation, lower cost
India Cements reports a fourfold net profit rise to ₹59 crore, driven by better realisation and reduced costs.
- April 25, 2026 15:51
Quarterly results

India Cements posts ₹70 crore profit in Q4 FY26, turnaround from year-ago loss
Screenshot 2026-04-25 154904.png
The India Cements Limited reported a profit after tax of ₹70 crore (before exceptional items) for the quarter ended March 31, 2026, a sharp reversal from a loss of ₹75 crore in the same quarter last year.
EBITDA for the quarter stood at ₹179 crore on a consolidated basis, up from ₹23 crore in Q4 FY25. After accounting for exceptional items of ₹11 crore, the reported consolidated PAT came in at ₹60 crore.
For the full year FY26, the consolidated EBITDA swung to a positive ₹484 crore from a negative ₹174 crore in FY25. PAT before exceptional items came in at ₹82 crore against a loss of ₹652 crore in the prior year. However, exceptional charges of ₹149 crore dragged the full-year reported consolidated PAT to a loss of ₹67 crore.
On the operational side, domestic cement sales volumes grew 18 per cent year-on-year to 3.12 million tonnes in Q4. Capacity utilisation rose to 84 per cent, an 11 percentage point improvement over Q4 FY25. Net realisations (net of logistics cost) improved 3.5 per cent sequentially and 6.2 per cent year-on-year to ₹3,791 per tonne.
Operating EBITDA per tonne improved significantly to ₹497 in Q4 FY26 from ₹305 per tonne in Q3 FY26. Fuel costs declined 4 per cent quarter-on-quarter and 16 per cent year-on-year to ₹912 per tonne, while power costs also eased. Raw material costs, however, rose 12 per cent sequentially to ₹1,053 per tonne.
The company completed its brand migration to UltraTech in March 2026. Looking ahead, India Cements has announced a capital expenditure plan of ₹2,000 crore over the next two years, targeting capacity expansion of 2.8 million tonnes per annum and scaling green power from 6 per cent to 80 per cent of its energy mix by FY29.
Net debt as of March 2026 stood at ₹1,271 crore, up from ₹1,135 crore a year earlier.
- April 25, 2026 15:42
Quarterly results
Sampann Utpadan posts ₹679 lakh full-year profit
Sampann Utpadan India Limited, formerly known as S. E. Power Limited, reported a standalone net profit of ₹679.29 lakh for the financial year ended March 31, 2026, a sharp turnaround from a loss of ₹3,365.25 lakh in reserves and surplus recorded in the previous year.
On a standalone basis, total revenue from operations for FY2026 stood at ₹14,264.20 lakh, up from ₹9,750.88 lakh in FY2025. Total expenses for the full year came in at ₹13,452.58 lakh against ₹10,054.77 lakh previously. Profit before tax for the year was ₹907.76 lakh. The company paid a deferred tax of ₹228.47 lakh, leaving a net profit of ₹679.29 lakh for the period. Earnings per share stood at ₹1.39 on both a basic and diluted basis.
On a consolidated basis, which includes wholly owned subsidiary M/s Shubham Electrochem Limited, total revenue was ₹14,360.30 lakh for FY2026. Consolidated profit after tax was ₹678.03 lakh, compared to ₹397.59 lakh in FY2025.
The company has two primary business segments — Non-Conventional Energy and Reclaimed Rubber. The Reclaimed Rubber division was the dominant revenue contributor, with full-year standalone segment revenue of ₹14,234.58 lakh. The Non-Conventional Energy segment reported a segment loss before tax and interest of ₹136.72 lakh for the year.
Total standalone assets as of March 31, 2026 stood at ₹14,887.19 lakh, against ₹12,010.64 lakh a year earlier.
- April 25, 2026 13:59
Quarterly results
RBL Bank posts ₹822 crore full-year net profit, gross NPAs nearly halved
RBL Bank on Saturday reported a standalone net profit of ₹822 crore for the financial year ended March 31, 2026, up from ₹695 crore in the previous year, as provisions fell sharply and loan growth accelerated. For the fourth quarter alone, the bank earned a net profit of ₹230 crore, compared to ₹69 crore in the same quarter last year.
The board, which met in Mumbai on April 25, 2026, also recommended a dividend of ₹1 per equity share of face value ₹10, subject to shareholder approval at the upcoming Annual General Meeting — unchanged from the previous year’s payout.
Asset quality improved markedly. Gross NPAs declined to 1.45 per cent of advances as of March 31, 2026, from 2.60 per cent a year ago. In absolute terms, gross NPAs fell to ₹1,675 crore from ₹2,465 crore. Net NPAs stood at 0.39 per cent, though this was slightly higher than the 0.29 per cent recorded a year ago in absolute net terms.
Total income for the full year rose to ₹18,457 crore from ₹17,845 crore. Interest income grew to ₹14,336 crore, while provisions other than tax dropped to ₹2,260 crore from ₹2,959 crore in FY25. The bank’s total advances expanded to ₹1,14,232 crore from ₹92,618 crore, and deposits surged to ₹1,39,018 crore from ₹1,10,944 crore — a sharp year-on-year increase.
Capital adequacy under Basel III stood at 14.25 per cent, down from 15.54 per cent a year earlier, remaining above regulatory requirements. Return on assets for the year was 0.53 per cent.
On the strategic front, the bank disclosed that Emirates NBD Bank (PJSC) has received RBI approval to acquire up to 74 per cent of RBL Bank’s paid-up share capital. The proposed preferential issue and a scheme to amalgamate Emirates NBD’s India branch into RBL Bank are currently awaiting further regulatory clearances. Upon completion, Emirates NBD would become the bank’s promoter.
- April 25, 2026 13:11
Quarterly results
Axis Bank Q4 profit dips slightly, full-year earnings fall 7% despite strong loan and deposit growth
Screenshot 2026-04-25 130420.png
Axis Bank reported a marginal decline in net profit for the January–March 2026 quarter, with earnings falling 0.6 per cent year-on-year to ₹7,071 crores, even as the bank posted strong growth in loans and deposits. For the full financial year FY26, net profit dropped 7 per cent to ₹24,457 crores from ₹26,373 crores in FY25, weighed down by higher provisions.
The bank took a significant one-time hit during Q4, voluntarily creating an additional standard asset provision of ₹2,001 crores, citing evolving macroeconomic and geopolitical uncertainties. Total provisions and contingencies for the quarter stood at ₹3,522 crores. The bank clarified the move was precautionary and did not reflect any deterioration in asset quality.
On the business front, performance was broadly healthy. Total deposits grew 14% year-on-year to ₹13,35,834 crores, while advances surged 19 per cent to ₹12,33,570 crores. The CASA ratio stood at 40 per cent on a month-end basis. Net Interest Income rose 5 per cent year-on-year to ₹14,457 crores in Q4, with the Net Interest Margin at 3.62 per cent. Fee income grew 8 per cent quarter-on-quarter and 4 per cent year-on-year to ₹6,561 crores.
Asset quality showed improvement, with Gross NPA declining to 1.23 per cent from 1.40 per cent in the previous quarter, and Net NPA easing to 0.37 per cent from 0.42 per cent. The Capital Adequacy Ratio stood at 16.42 per cent.
The bank’s balance sheet expanded 17 per cent year-on-year to ₹18,86,850 crores as of March 31, 2026. Corporate loans led growth at 38 per cent year-on-year, while SME loans grew 24 per cent. Return on equity for FY26 stood at 13.15 per cent, down from 16.52 per cent in FY25, reflecting the pressure from elevated provisions.
The board recommended a dividend of ₹1 per equity share. MD & CEO Amitabh Chaudhry said the bank closed the year on a strong note but flagged awareness of global macro and geopolitical risks heading into FY27.
- April 25, 2026 12:25
Banking

UCO Bank appoints new Chief Compliance Officer ahead of Q4 results
UCO Bank has appointed Neeraj Daporkar, a General Manager, as its new Chief Compliance Officer (CCO) effective April 24, 2026, replacing Ravi Shankar Narayan, who has been moved to a different role within the bank. The leadership change comes as the public sector lender prepares to announce its fourth quarter and annual results.
Daporkar, 47, brings over 19 years of banking experience spanning branch operations, overseas centres, zonal offices, and corporate departments. He holds a postgraduate degree in Information Technology and a graduate degree in Computer Science and Engineering, and is a Certified Associate of the Indian Institute of Bankers (CAIIB). He also carries multiple certifications from the Indian Institute of Banking and Finance (IIBF) covering areas including international trade finance, foreign exchange operations, treasury, cyber crime prevention, and information system audit.
- April 25, 2026 12:19
Quarterly results
Mantra Capital posts ₹1,346 lakh annual loss as costs surge
Mantra Capital Limited, a Mumbai-based non-banking financial company formerly known as Savani Financials Limited, reported a net loss of ₹1,346.36 lakh for the financial year ended March 31, 2026, more than 53 per cent higher than the ₹878.61 lakh loss recorded in the previous financial year.
For the fourth quarter ended March 31, 2026, the company posted a net loss of ₹483.02 lakh, compared to a loss of ₹400.48 lakh in the same quarter of the prior year and ₹306.01 lakh in the preceding December 2025 quarter.
Revenue from operations rose sharply to ₹1,632.25 lakh for the full year, up from ₹335.25 lakh in FY2025, driven primarily by interest income which jumped to ₹1,380.25 lakh from ₹130.51 lakh. However, total expenses surged to ₹2,994.26 lakh from ₹1,219.39 lakh, with employee benefit costs of ₹1,390.36 lakh and finance costs of ₹600.19 lakh being the largest drags.
The company’s balance sheet expanded significantly, with total assets reaching ₹12,086.01 lakh as of March 31, 2026, compared to ₹4,827.42 lakh a year earlier. The loan book grew to ₹9,996.35 lakh from ₹2,614.59 lakh. Borrowings other than debt securities stood at ₹7,811.76 lakh, up from ₹493.93 lakh.
Statutory auditor M/s. Jayantilal Thakkar & Co. issued an unmodified audit opinion on the financial statements. The Board also appointed M/s. A.P. Sanzgiri & Co. as internal auditors for FY2026-27.
On the rights issue front, the company confirmed there was no deviation in the utilisation of the ₹4,898.23 lakh raised through its rights issue, with funds deployed toward capital augmentation, loan repayment, and general corporate purposes.
- April 25, 2026 12:07
Quarterly results
Lodha Developers bets on data centres and low leverage as it targets sustained growth after record FY26
Lodha Developers bets on data centres and low leverage as it targets sustained growth after record FY26
Lodha Developers targets sustained growth through data centres and low leverage after achieving record profits in FY26.
- April 25, 2026 12:06
Quarterly results
Can Fin Homes posts 31% jump in Q4 profit, full-year earnings cross ₹1,000 crore mark
Can Fin Homes Limited (CFHL) reported a net profit of ₹346 crore for the fourth quarter of FY26, up 31 per cent from ₹265 crore in the same period last year. For the full fiscal year ended March 31, 2026, the Bengaluru-based housing finance company posted a profit after tax of ₹1,086 crore, a 27 per cent rise over ₹857 crore in FY25. The Board of Directors approved the financials at their meeting on April 24, 2026.
The company’s loan assets grew 10 per cent year-on-year to ₹42,209 crore as of March 2026, compared to ₹38,217 crore a year earlier. On a sequential basis, loan assets rose 4 per cent from ₹40,693 crore in Q3 FY26. Housing loans account for 72 per cent of the total loan book, with non-housing loans including commercial real estate making up the remaining 28 per cent.
Loan disbursements for FY26 stood at ₹10,531 crore, a 23 per cent increase over ₹8,568 crore in FY25, reflecting stronger business momentum across its retail network.
Profitability metrics improved meaningfully. Return on assets for Q4 FY26 came in at 3.29 per cent, up from 2.55 per cent in Q3 FY26, while return on equity rose to 23.12 per cent from 18.80 per cent in the previous quarter. Net interest margin expanded to 4.19 per cent in Q4 from 4.14 per cent in Q3. For the full year, NIM stood at 3.93 per cent against 3.64 per cent in FY25. The debt-to-equity ratio improved to 6.40 from 6.96 a year ago.
On the provisions front, CFHL carries total provisions of ₹499 crore against a required ECL provision of ₹400 crore under Ind AS 109, which includes a management overlay of ₹59 crore and ₹40 crore for restructured accounts.
The company’s liquidity coverage ratio stood at a comfortable 563.50 per cent as of March 31, 2026, well above the regulatory minimum of 100 per cent
Screenshot 2026-04-25 120154.png
. Undrawn bank lines totalled ₹2,540.92 crore.
CFHL currently operates 249 branches and offices across 21 states and union territories. Its fixed deposit programme and long-term debt instruments carry AAA ratings from both CARE and ICRA.
- April 25, 2026 10:25
Quarterly results
Shriram Finance Q4 net profit jumps 41%
Shriram Finance Q4 net profit jumps 41 per cent
Shriram Finance reports a 41% rise in Q4 net profit, driven by strong loan growth across multiple segments.
- April 25, 2026 10:16
Quarterly results
Reliance Retail reports stable Q4 growth amid margin pressures
Reliance Retail reports stable Q4 growth amid margin pressures
Reliance Retail reports 10.8% Q4 revenue growth to ₹98,232 crore amid margin pressures and aggressive store expansion.
- April 25, 2026 10:12
Economy

J.P. Morgan upgrades Taiwan, tech to overweight; cuts India to neutral amid AI surge and stagflation
J.P. Morgan upgrades Taiwan, tech to overweight; cuts India to neutral amid AI surge and stagflation
J.P. Morgan upgrades Taiwan and tech to overweight while downgrading India to neutral due to economic headwinds and AI growth.
- April 25, 2026 10:11
Stock market

IT rout and crude surge drag Nifty to third straight loss
IT rout and crude surge drag Nifty to third straight loss
Nifty and Sensex face losses as IT stocks plunge and crude oil prices surge, marking a challenging market environment.
- April 25, 2026 10:09
Quarterly results
Reliance Jio profit grows 13% to ₹7,935 crore in Q4
Reliance Jio profit grows 13% to ₹7,935 crore in Q4
Revenue up 12.7% on ARPU growth and subscriber additions; EBITDA margin expands 190 bps
- April 25, 2026 10:08
Quarterly results
Reliance Ind Q4 net dips 12.6% sapped by energy business
Reliance Ind Q4 net dips 12.6% sapped by energy business
Reliance Industries’ quarterly net profit drops 12.6% to ₹16,971 crore, despite consumer business growth and revenue increase.
- April 25, 2026 10:06
Quarterly results
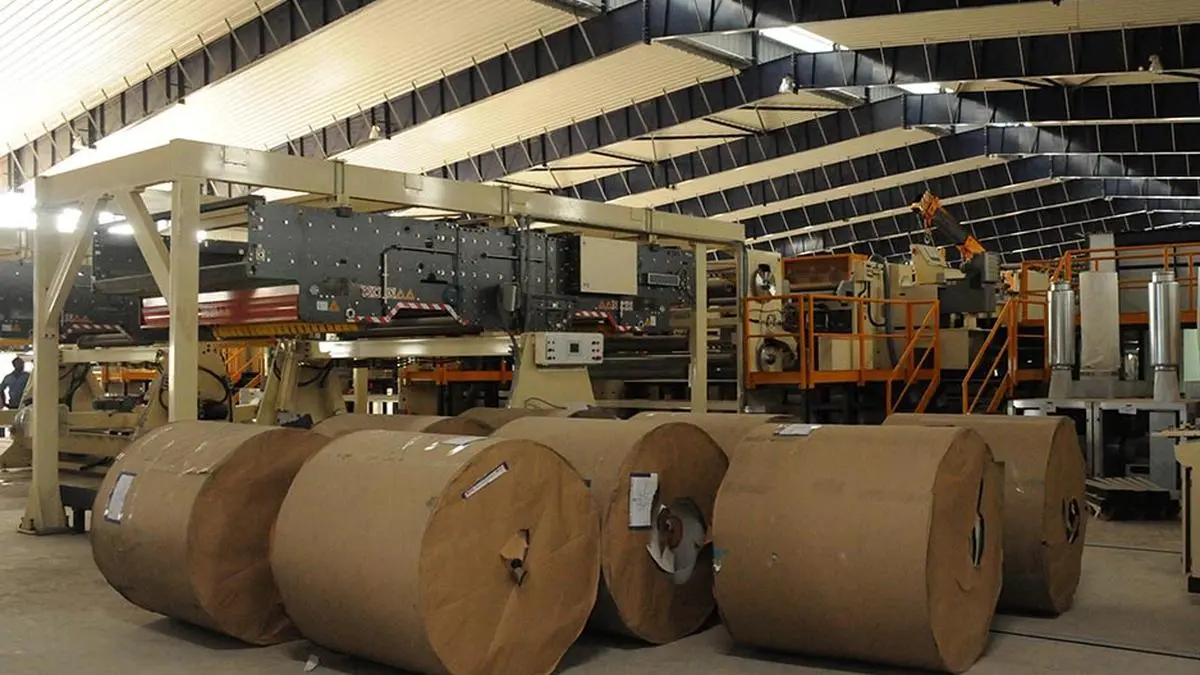
TNPL FY26 profit rises on deferred tax restatement
TNPL FY26 profit rises on deferred tax restatement
Full-year profit rises to ₹248 crore on deferred tax reversal amid volatile paper market
- April 25, 2026 10:04
Industry update

Solar Sector Update | Anti-Dumping Duty Noise – No Material Impact
Recent headlines around the proposed anti-dumping duties on solar panel shipments from India, Indonesia, and Laos appear more sentiment-driven than fundamentally impactful.
It’s important to note that leading players like Waaree Energies, Premier Energies, and Emmvee PV had already addressed these concerns in detail during February interactions.
Key Takeaways:
* The proposed ~126% preliminary CVD applies specifically to modules using India-made cells.
* Waaree Energies does not use India-origin cells for its US shipments, thereby mitigating any direct exposure.
* Tariff applicability is linked to the cell’s country of origin, not the module assembly location.
* The company has proactively built a non-China, diversified supply chain for US markets since 2019, ensuring regulatory resilience.
Operational Strength Remains Intact:
* US module capacity at ~2.6 GW, scaling up to ~4.2 GW by Oct–Dec
* Additional 1 GW capacity in Arizona ready for deployment
* Incremental capacities expected to be operational within this financial year
* Strong order book of ~₹60,000 crore (net of 9M dispatches), providing multi-year revenue visibility
* FY26 is shaping up to be a strong growth year, particularly driven by robust US demand
The current development is largely headline noise with minimal fundamental impact on Indian listed solar companies.
Any near-term price correction should be viewed as an opportunity to accumulate quality names, given the strong execution visibility and structural tailwinds in global solar demand.
- April 25, 2026 10:02
Stock market
ALL-TIME HIGH BREAKOUT ALERT: 24th April
Today, these 6 stocks closed above their lifetime highs, signaling strong momentum and sustained buying interest:
Hitachi Energy
Schneider Electric
Atlanta Electricals
TD Power Systems
AU Small Finance Bank
Quality Power Electrical Equip.
- April 25, 2026 10:01
Banking
RBI order on cancellation of Paytm’s Payment Bank License
There will be no impact on the company’s revenue, as the exposure to payments banks was zero. Following the RBI embargo on payments banks, the entire equity exposure to Paytm Payments Bank has already been written off.
The current payment ecosystem remains intact, and we do not see any financial implications. The Payments Bank was already inactive, and all merchant and customer accounts had been migrated by Paytm.
Regarding the wallet business, the company can apply for a fresh PPI license and may restart operations upon receiving approval.
Haitong IE Sales
- April 25, 2026 10:00
Economy
Jefferies on GMR Airports
India | Airport
GMR Airports Infrastructure Ltd| BUY
GMRAIRPO IN | INR96.42 | PT: INR125 | % to PT: +30%\u0009
GMR Promoter Group Increases Stake
GMR Promoter is acquiring a 7.3% stake in GAL from ADP via a stake purchase & FCCB buyback totalling ~€924mn, lifting its ownership while ADP’s economic interest would dip to ~39.8%. The deal is valued at Rs85-87/share, 10-12% discount at CMP, suggesting strategic promoter-to-promoter transaction, yet establishing a credible valuation floor. We believe GMR promoters consolidating its stake in the Co signals strong internal conviction on GAL’s growth trajectory.
- April 25, 2026 09:59
Quarterly results
IndusInd Bank logs ₹533 cr profit in Q4FY26 against a huge loss in Q4FY25
IndusInd Bank logs ₹533 cr profit in Q4FY26 against a huge loss in Q4FY25
IndusInd Bank reports ₹533 crore profit in Q4FY26, rebounding from a loss last year, driven by strong interest income growth.
- April 25, 2026 09:58
Quarterly results
Hindustan Zinc reports 68% Q4 profit surge driven by rising metal prices
Hindustan Zinc reports 68% Q4 profit surge driven by rising metal prices
Hindustan Zinc reports a 68% profit surge in Q4, driven by rising metal prices and strong revenue growth.
- April 25, 2026 09:56
Quarterly results
Mahindra Finance Q4 profit jumps 55%, FY26 earnings up 19%
Mahindra Finance Q4 profit jumps 55%, FY26 earnings up 19%
Mahindra Finance reports 55% profit jump in Q4 FY26, with strong disbursements and asset growth driving overall earnings up 19%.
- April 25, 2026 09:54
Stock down

Hindustan Zinc posts record quarterly profit of ₹5,033 crore, stock slips 0.61%
Hindustan Zinc Q4 Results: Profit record at ₹5,033 cr, stock slips 0.61%
Annual revenue and profit hit record highs on higher volumes and metal prices
- April 25, 2026 09:53
Quarterly results
CPCL Q4 net profit triples on refining margin boost
CPCL Q4 net profit triples on refining margin boost
CPCL’s Q4 net profit surged threefold, driven by increased refining margins amid rising oil prices from geopolitical tensions.
- April 25, 2026 09:52
Economy
JP Morgan, HSBC cut India ratings on oil, inflation concerns despite strong long term outlook
JP Morgan, HSBC cut India ratings on oil, inflation concerns
JP Morgan and HSBC downgrade India’s equity ratings amid oil and inflation concerns, while maintaining a strong long-term growth outlook.
- April 25, 2026 09:50
Quarterly results
Adani Green reports higher quarterly profit on strong power sales
Adani Green reports higher quarterly profit on strong power sales
Adani Green reports a 34% profit increase, fueled by strong power sales amid India’s renewable energy expansion efforts.
- April 25, 2026 09:48
Stock down
Cyient shares slide 4% after Q4 miss; buyback at premium offers limited cushion
Cyient shares slide 4% after Q4 miss; buyback at premium offers limited cushion
Cyient shares drop 4% after Q4 profit miss, despite buyback support; market sentiment remains cautious amid sell pressure.
- April 25, 2026 09:47
Stock down
Infosys shares fall 7% after Q4, muted guidance weighs
Infosys shares fall 7% after Q4, muted guidance weighs
Infosys shares hit a 52-week low following cautious Q4 guidance, signaling a subdued demand environment and lower growth expectations.